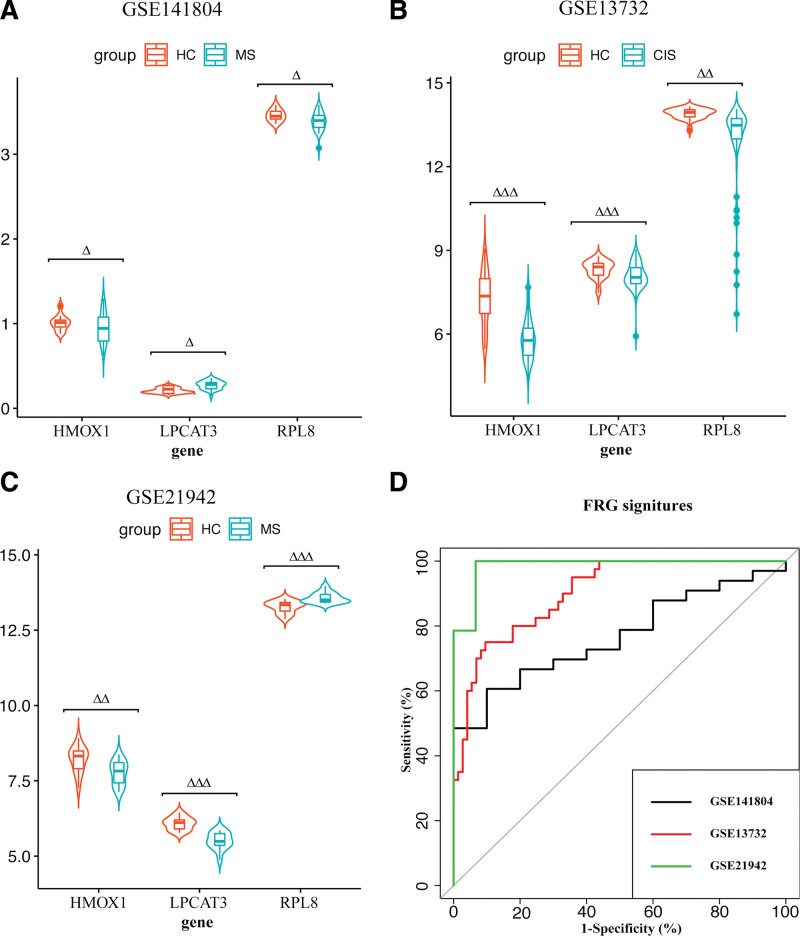
Figure 5.
Validation of HMOX1, LPCAT3, and RPL8 in the Gene Expression Omnibus (GEO) datasets. (A) HMOX1, LPCAT3, and RPL8 gene expression differences between multiple sclerosis (MS) samples and normal control (NC) samples in GSE141804. (B) HMOX1, LPCAT3, and RPL8 gene expression differences between MS samples and NC samples in GSE13732. (C) HMOX1, LPCAT3, and RPL8 gene expression differences between MS samples and NC samples in GSE21942. The green box indicated MS samples, and the orange box indicated NC group. (D) Receiver operating characteristic (ROC) curves of HMOX1, LPCAT3, and RPL8 predicting MS. ROC curves showed the sensitivities and specificities of differentiating MS from NC with three ferroptosis-related gene (FRG) signatures in GSE141804, GSE13732, and GSE21942. The black line indicated GSE141804. The red line indicated GSE13732. The green line indicated GSE21942. ∆P < .05; ∆∆P < .01; ∆∆∆P < .001. FRG = ferroptosis-related gene, GEO = gene expression omnibus, GSE = gene expression omnibus series, CIS = clinically isolated syndrome, MS = multiple sclerosis, NC = normal control, ROC = receiver operating characteristic.

