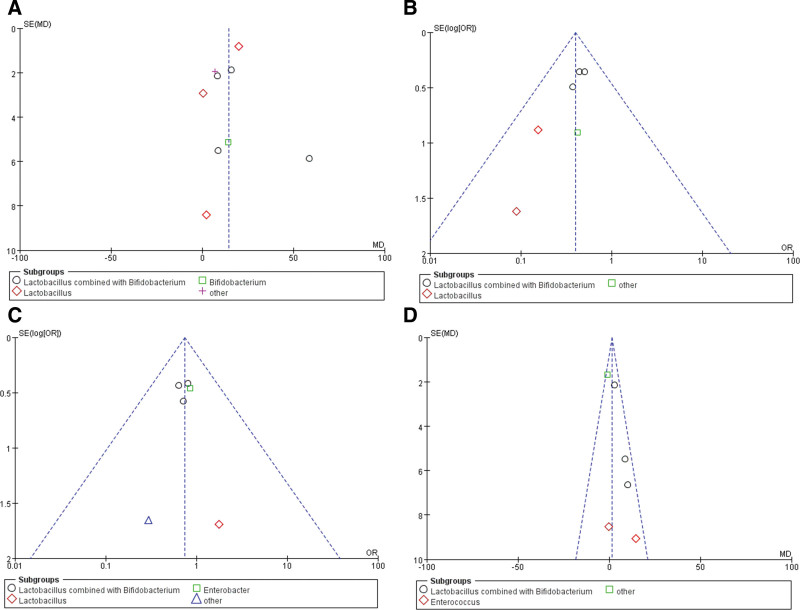
Figure 5.
Publication bias in the funnel plots. (A) Publication bias in the changes of blood ammonia between the probiotics and the placebo groups. (B) Publication bias in the incidence of HE. (C) Publication bias mortality. (D) Publication bias the changes of blood ammonia between the probiotics and the lactulose groups. HE = hepatic encephalopathy.

