
Figure 2.
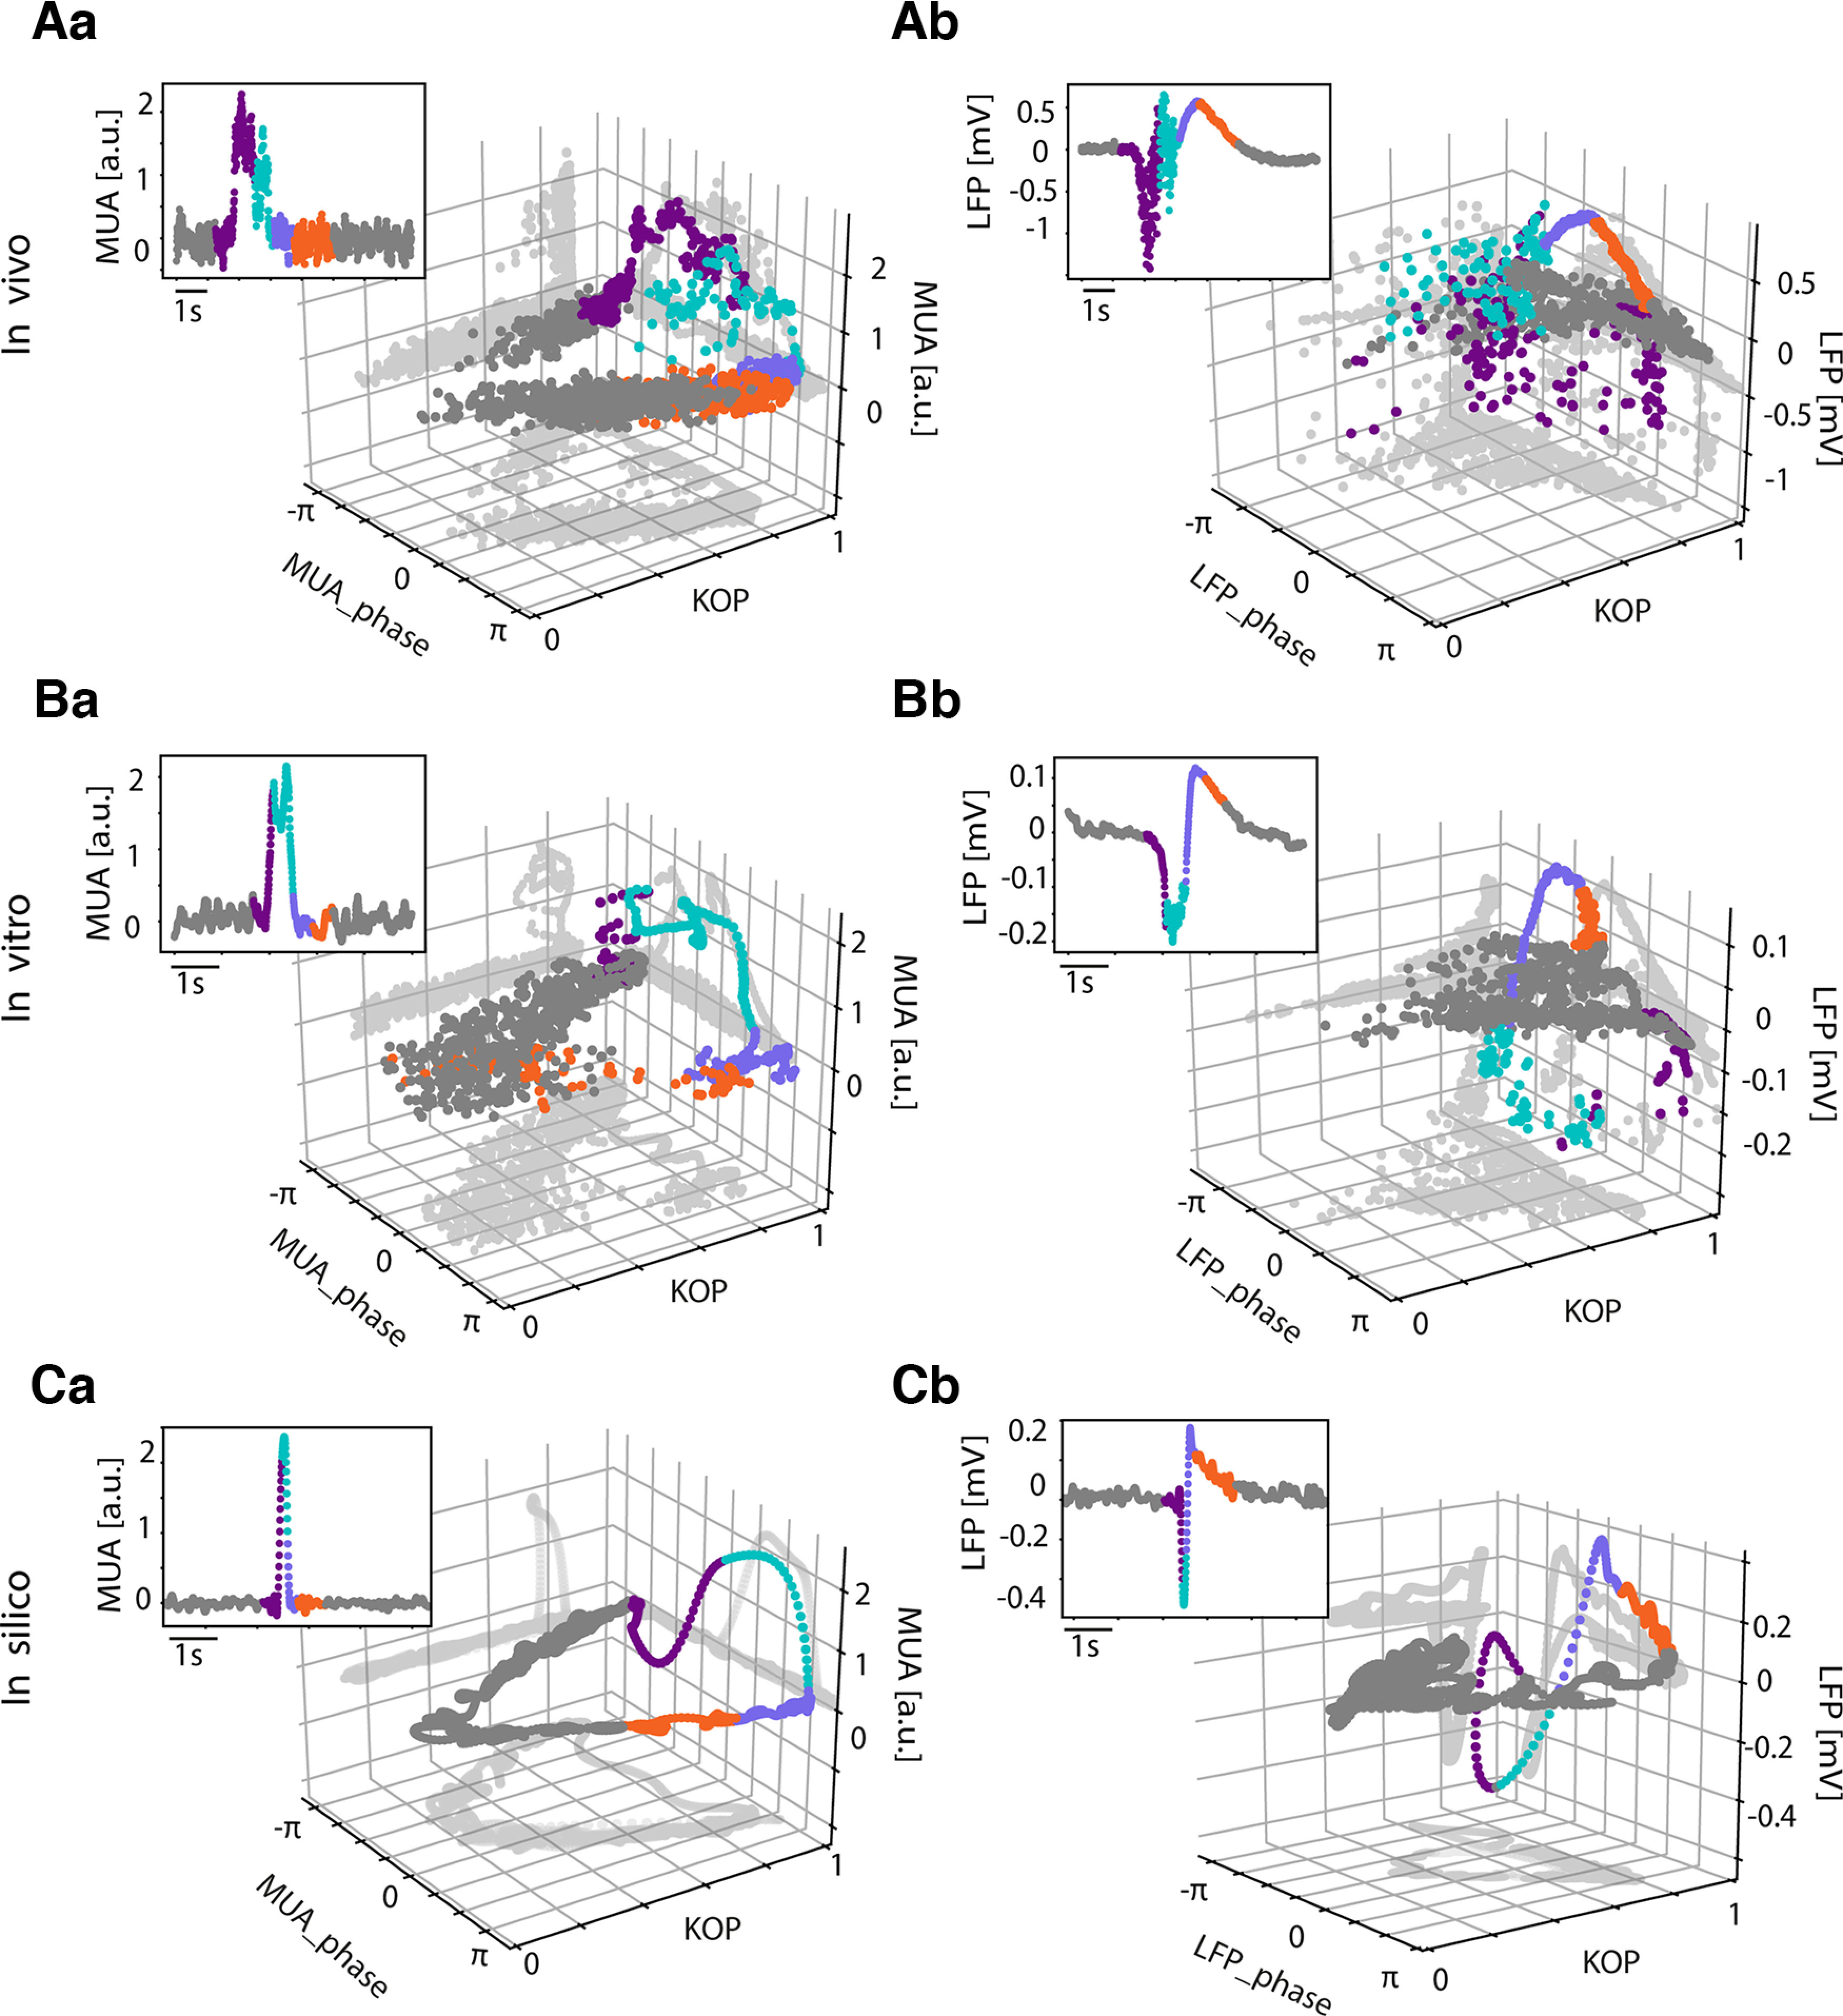
Multiunit activity (MUA) and local field potential (LFP) synchronization dynamics. A, In vivo 3D representation of the phase, amplitude, and Kuramoto order parameter (KOP) corresponding to the slow oscillation cycle depicted in the 2D insert in MUA (Aa) and LFP (Ab). B, In vitro 3D representation of the phase, amplitude, and KOP corresponding to the SO cycle depicted in the 2D insert in MUA (Ba) and LFP (Bb). C, In silico 3D representation of the phase, amplitude, and KOP corresponding to the slow oscillation cycle depicted in the 2D insert in MUA (Ca) and LFP (Cb). The points are colored according to time, the purple coincides with the Down-to-Up transition, turquoise corresponds to the Up state, violet is the Up-to-Down transition, orange is the beginning of the Down state and the rest of the Down state is in gray; gray shades represent the projections of the cloud on each plane.