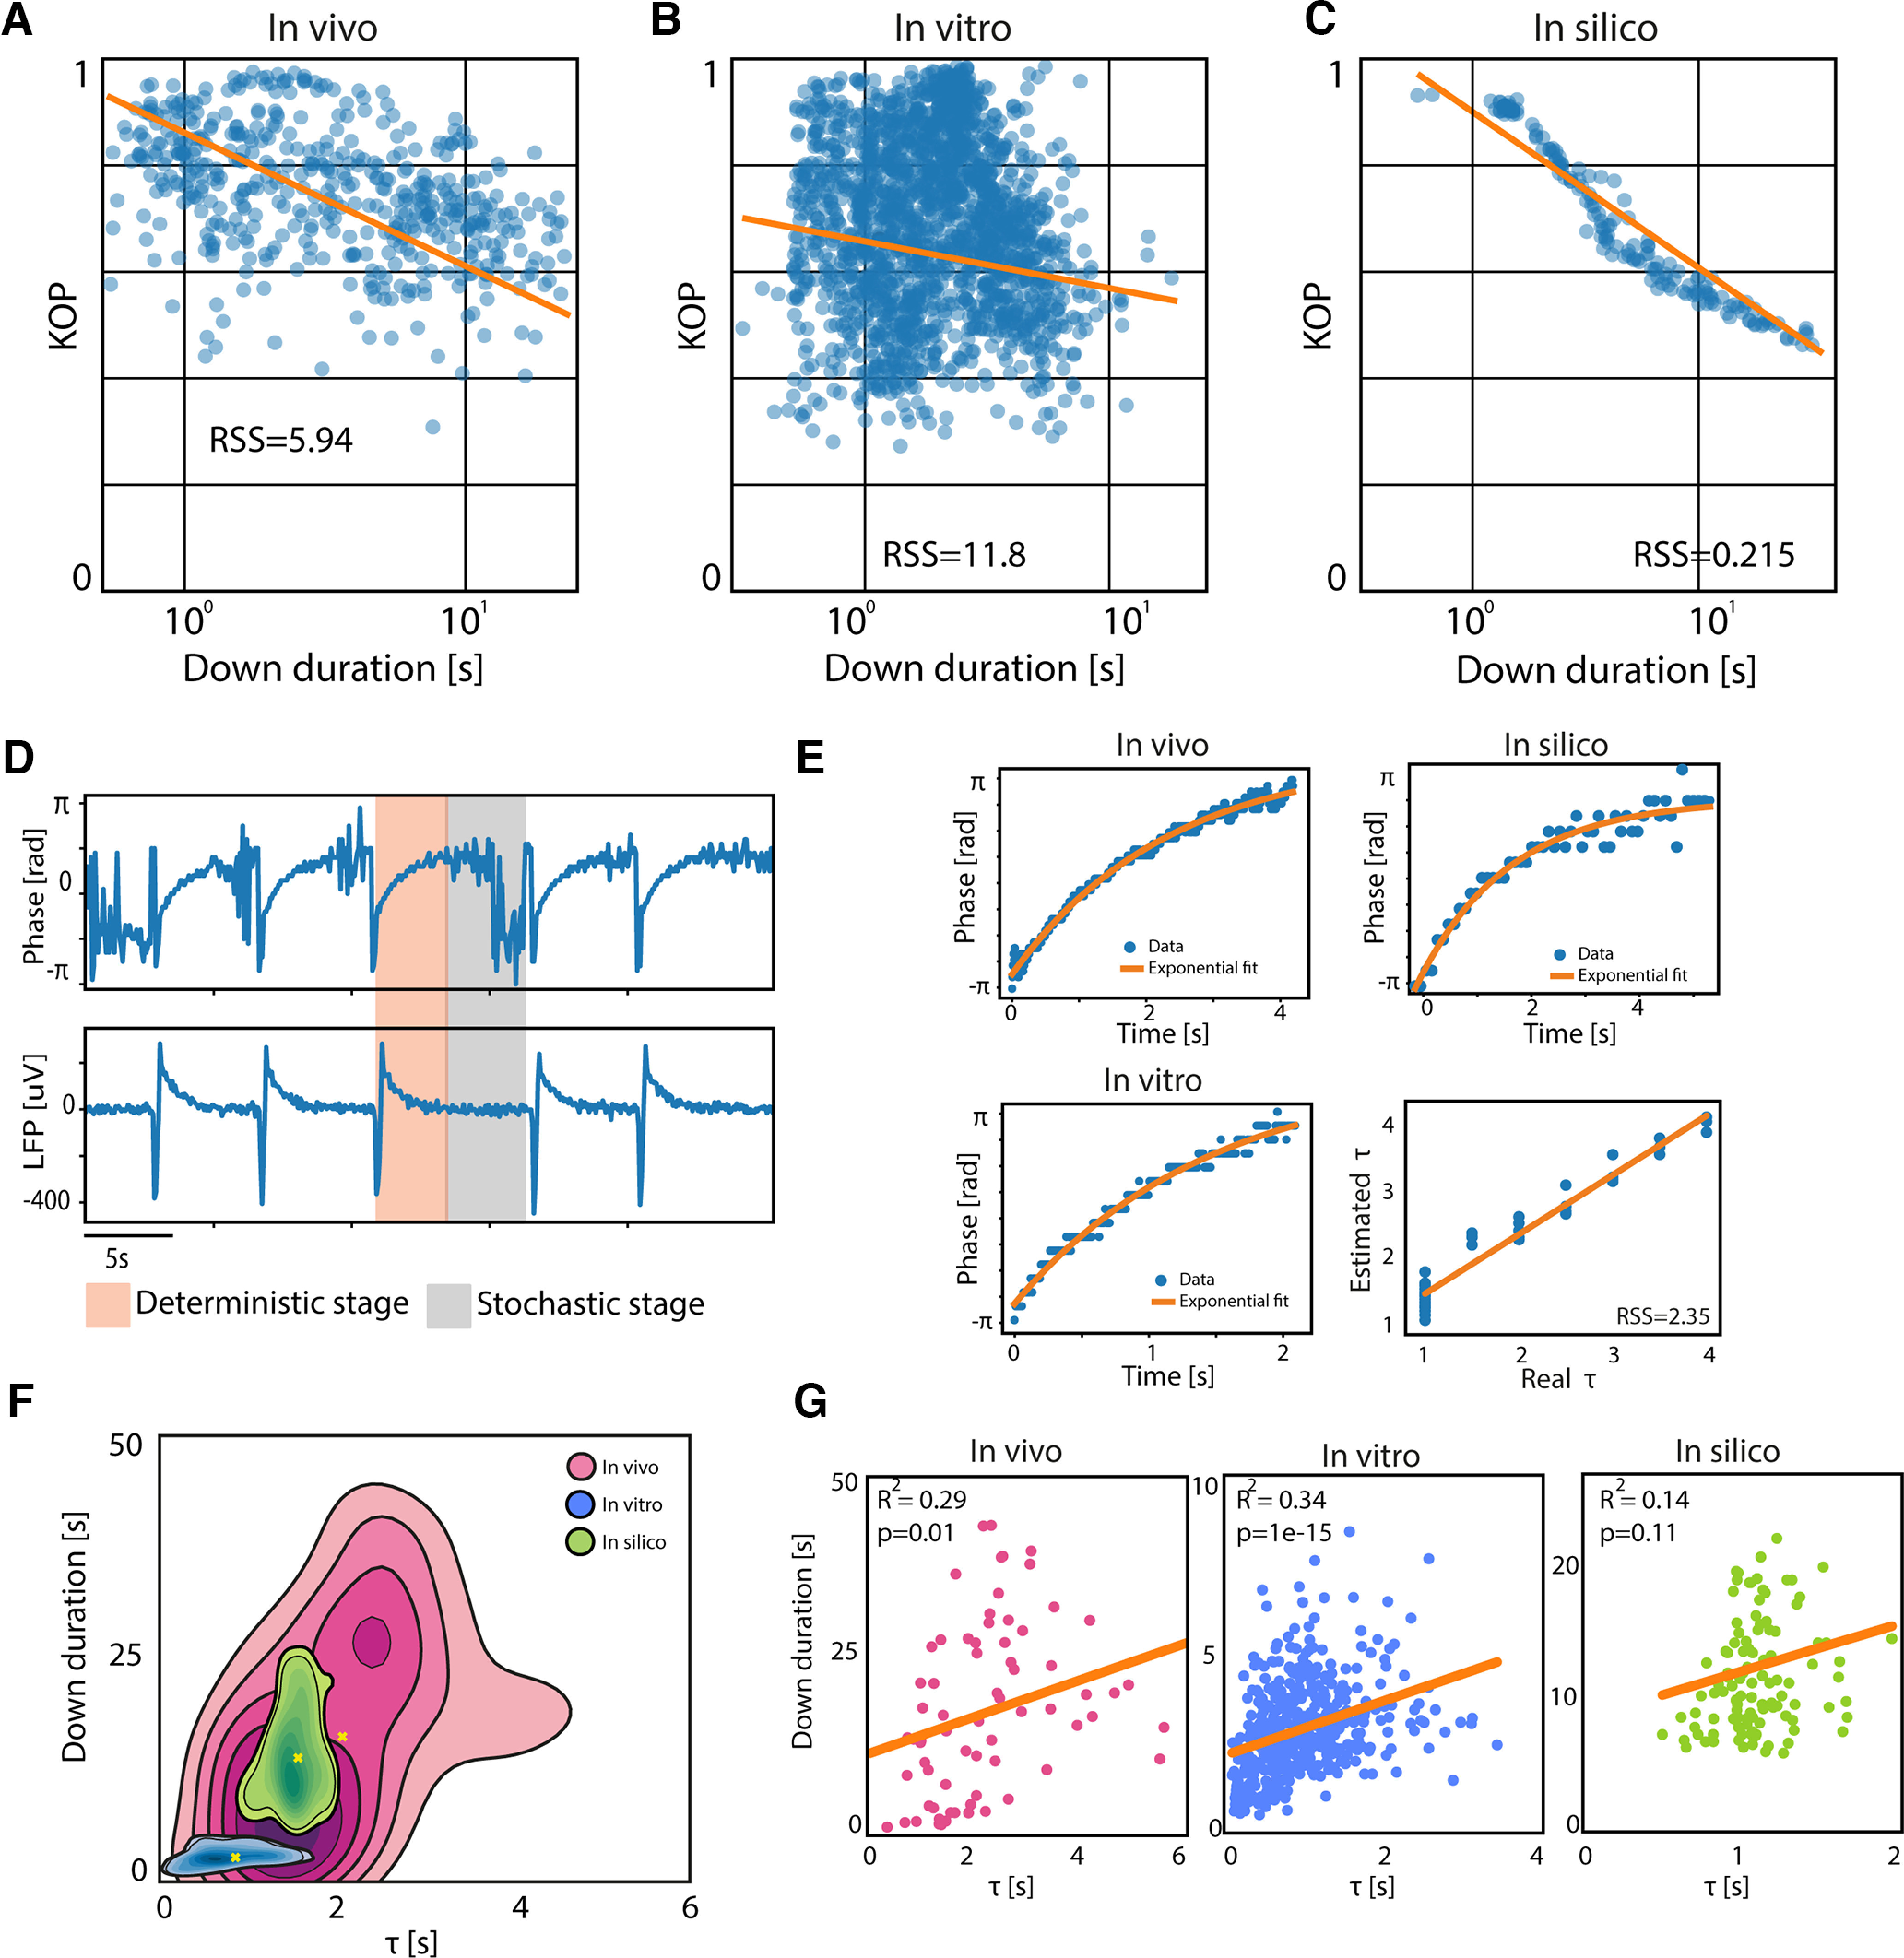
Figure 4.

Metastability of the Down state and its characteristic time scale. Correlation between the mean Kuramoto order parameter (KOP) of the LFP during the Down states, and the Down state duration. Each point in the figures represents a single Down state, where the modulation of its duration was obtained through varying anesthesia in vivo (A; R2 = −0.45, p = 1e-29), using DC fields of different polarities in vitro (B; R2 = −0.1, p = 0.02) and changing model's parameters in silico (C; R2 = −0.9, p = 1e-93). D, τ estimation method: bottom panel shows the local field potential (LFP) extracted from one module of a simulated network (in silico); upper panel shows the corresponding time evolution of the maximum of the LFP phase histogram; the gray area corresponds to the “deterministic” stage of the Down state where we estimated the τ, while the pink area corresponds to the “stochastic” stage. E, Example of exponential fitting for τ estimation in vivo (top left), in vitro (bottom left), and in silico (top right); regression plot of the real τ versus the estimated τ in silico with residual sum of squares (RSS) of 1.46. F, Kernel density estimation (KDE) of Down durations versus τ in vivo, in vitro, and in silico. G, Linear correlation between Down duration and τ in vivo (RSS = 9e+03), in vitro (RSS = 681), and in silico (RSS = 2e+03).
