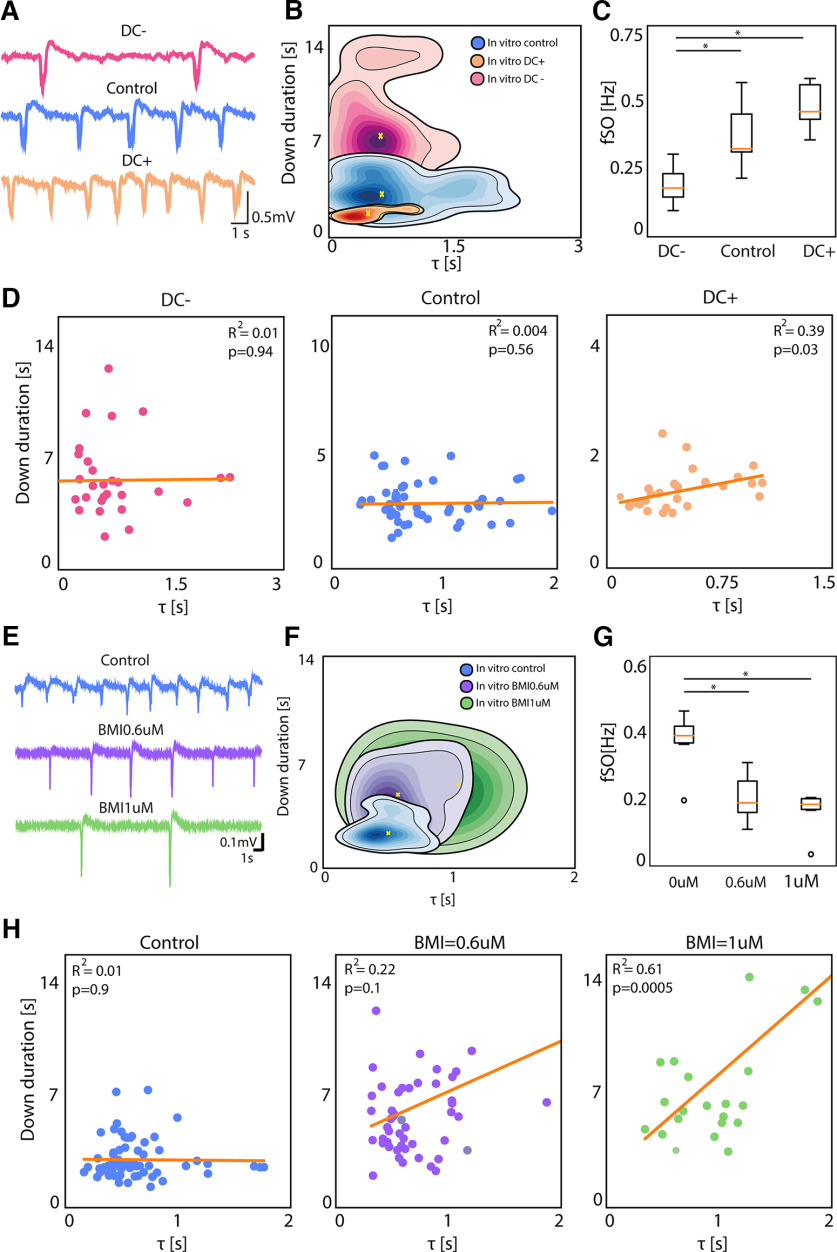
Figure 6.
In vitro activity modulation effect on network dynamics. A, Traces representing the local field potential (LFP) recording from one electrode in vitro under negative DC stimulation, control conditions and positive DC stimulation. B, Kernel density estimation (KDE) of Down durations versus τ in vitro with negative DC, control conditions and positive DC. C, Boxplot of the average frequency of slow oscillations for each slice (N = 6) under negative DC stimulation, control conditions and positive DC stimulation (Friedman test p = 0.014, *p < 0.05). D, Linear correlation between Down duration and τ in vitro under negative DC stimulation (RSS = 201), control conditions (RSS = 19.9) and positive DC stimulation (RSS = 3.6). E, Traces representing the LFP recording from one electrode in vitro under control conditions and with bath application of bicuculline (BMI) at two different concentrations: 0.6 and 1 μm. F, KDE of Down durations versus τ in vitro under control conditions and with BMI at 0.6 and 1 μm. G, Boxplot of the average frequency of slow oscillations for each slice (N = 6) under control conditions and with BMI at 0.6 and 1 μm (Friedman test p = 0.014, *p < 0.05). H, Linear correlation between Down duration and τ in vitro under control conditions (RSS = 88.6), with BMI 0.6 μm (RSS = 1e+03), and BMI 1 μm (RSS = 721).

