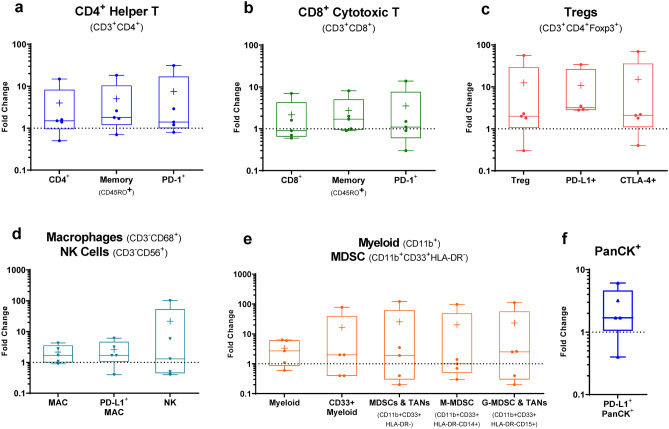
Fig. 11.
Changes in immune cell density in NMIBC subjects fold change in immune cell densities (cells/mm2) from biopsies collected before and after LSAM-DTX therapy as determined by mIF. Boxplots show min. to max. fold changes (extremes), per subject data (dots), mean ( +), and median (line) for n = 5 subjects analyzed. Cell types are identified using marker co-expression over an average of 24 regions of interest (ROI; range = 7 to 37) within the TME per slide. ROI selected by a pathologist blinded to treatment-status on a hematoxylin and eosin-stained slide. Cell type density is the total number of cells counted divided by the total area (sum of all ROI areas) per slide. In cases where the pre-LSAM-DTX cell density was 0 cells/mm2, no data is reported and n < 5. a CD4+ Helper T cells. b CD8+ cytotoxic T cells. c Treg cells. d Macrophage (MAC) and NK cells. e Myeloid and MDSC cells; MDSC and tumor-associated neutrophils (TANs). (f) PanCK+PD-L1.+. Adapted with permission from [12]

