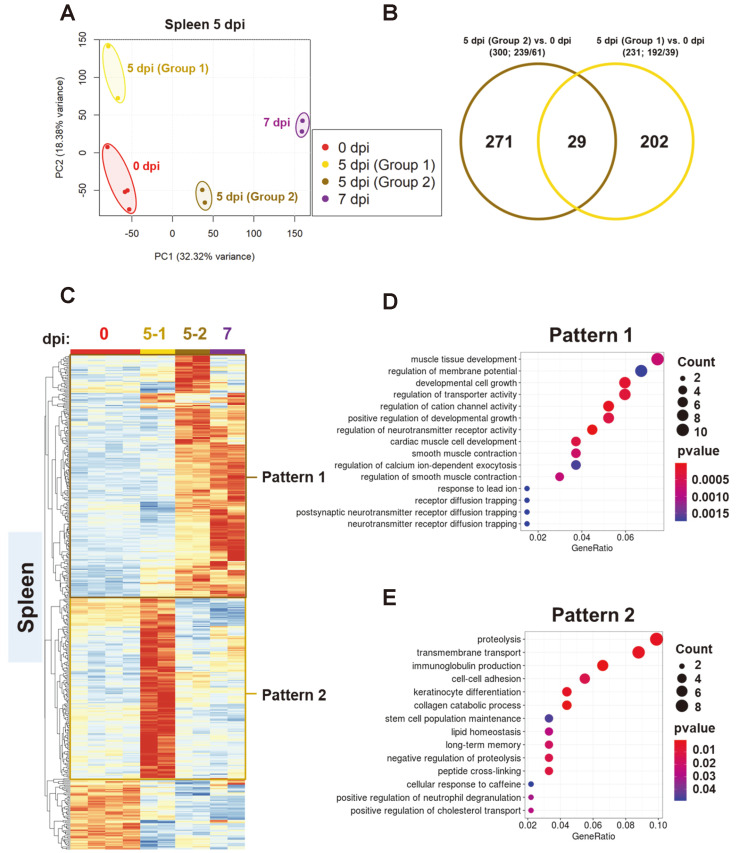
Fig. 5. Dinstinct the transcriptional profiles of the two spleen groups 5 days post SARS-CoV-2 infection in K18-hACE2 transgenic mice.
(A and B) Principal component analysis (PCA) plot for RNA-seq data of total number of genes in the spleen isolated at 0, 5-1 (non-fatal group), 5-2 (fatal group), and 7 dpi; 231 and 300 differentially expressed genes (DEGs) were selected [P < 0.005 (ANOVA) and |fold change| > 2] and normalized TPM (transcripts per million) were used for PCA. (C) Heatmaps from cluster analysis (Euclidean, complete linkage) of 449 DEGs in samples from the two spleen groups 5 dpi compared with that at 0 dpi. DEGs were classified into two expression patterns. Gene expression levels in the heatmaps are z-score normalized values determined from normalized TPM values. (D and E) Gene ontology (GO) enrichment analysis of genes belonging to each expression pattern in the spleen. GO category representing a biological process was analyzed, and the top 15 GO terms were listed after eliminating redundant terms. Dot color and size represent P value and gene ratio (gene counts in specific term/total genes), respectively.

