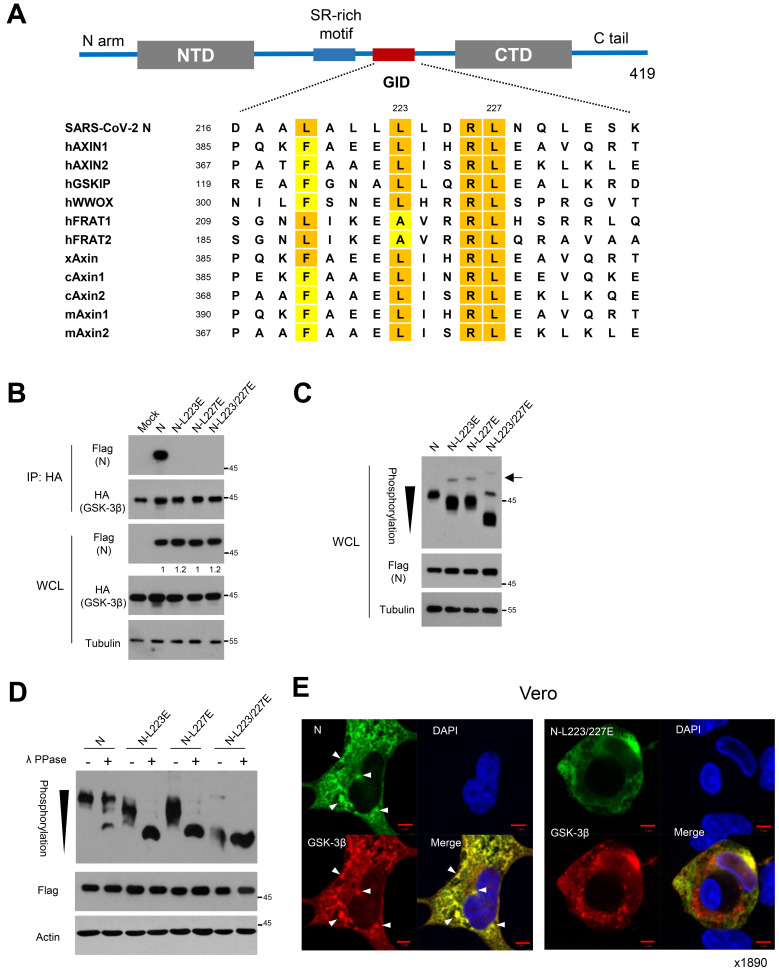
Fig. 1. Potential GID in N of SARS-CoV-2 is responsible for phosphorylation of N.
(A) Schematic diagram of structural organization of SARS-CoV-2 N protein (upper). The Ser/Arg (SR)-rich motif and potential GID are located in the central disordered region. Sequence alignment of GID (L/FxxxL/AxxRL) in SARS-CoV-2 N and endogenous GSK-3 interacting proteins with human (h), mouse (m), xenopus (x), and chicken (c). Highlights are shown for conserved hydrophobic residues of Lue, Phe, and Ala (lower). (B) Flag-tagged N and mutants harboring Lue to Glu substitutions with HA-tagged GSK-3β were expressed in 293 cells. Interaction between N or mutants and GSK-3β were determined following immunoprecipitation (IP) with anti-HA beads. Whole cell lysate (WCL) serve as input abundance for IP. (C) Ancestral or mutant N expression vectors were transfected into 293 cells, and the lysates were subjected to western blot and Phos-tag gel analysis to determine protein abundance and mobility shift by phosphorylation status of N, respectively. Black arrowhead indicates number of phosphorylation residues of N on a Phos-tag gel. Black arrow indicates minor bands of hyperphosphoryation of N mutants in Phos-tag analysis. (D) N or mutant N lysates were subjected to lambda protein phosphatase (λ PPase) followed by Phos-tag gel analysis. Black arrowhead indicates number of phosphorylation residues of N on a Phos-tag analysis. (E) Confocal images of ancestral N or L223/227E mutant (green) and GSK-3β (red) in Vero cells. Arrowheads indicate co-localized foci of N and GSK-3β in condensate-like structures. Nuclear staining with DAPI (blue). Scale bars = 5 μm.

