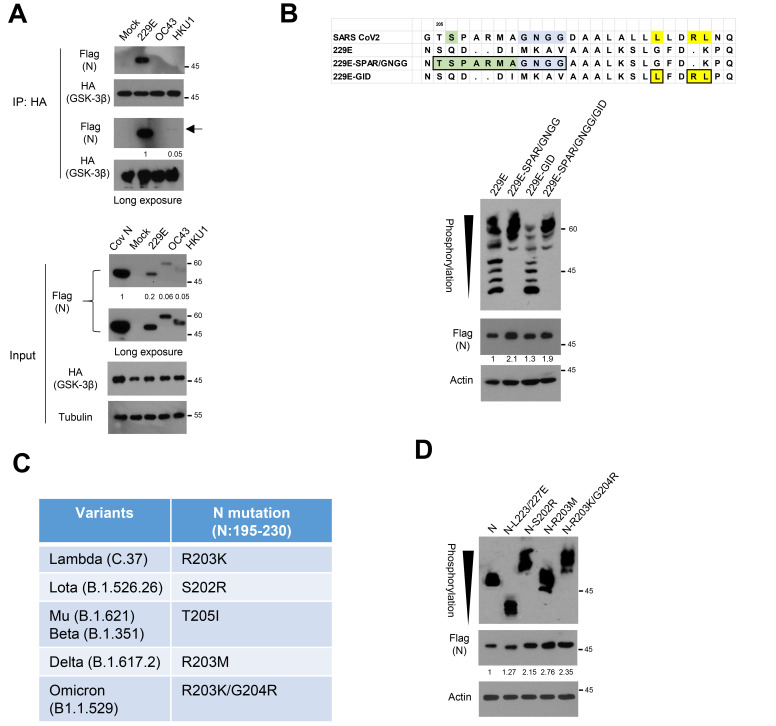
Fig. 5. N in other coronaviruses and N variants.
(A) The ancestral N or N from 229E, OC43, and HKU1 were co-transfected with HA-tagged GSK-3β into 293 cells, and the lysates were subjected to immunoprecipitation (IP) with anti-HA and subsequent western blot analysis to determine N binding affinity. Relative binding affinity of 229E and HKU1 corresponding each input was measured in a long exposure film. (B) Sequence alignment of 229E-N expression vectors having CDK1 phosphorylation site and Gly-rich linker (SPAR/GNGG) or GSK-3 interacting domain (GID) found in SARS-CoV-2 N (upper). The 229E-N or mutants were transfected into 293 cells. The lysates were subjected to western blot and Phos-tag gel analysis to determine protein abundance and mobility shift by phosphorylation status of 229E-N, respectively. Black arrowhead indicates number of phosphorylation residues of N on a Phos-tag analysis. (C) Mutation profiles of N between SR-rich motif and GID (N195-230) in SARS-CoV-2 variants (https://cov-lineages.org/constellations). (D) Ancestral N and mutants found in the variants were transfected into 293 cells. The lysates were subjected to western blot and Phos-tag gel analysis to determine protein abundance and phosphorylation status of N and mutants, respectively. Black arrowhead corresponds to the increased phosphorylation in Omicron variant and ancestral N phosphorylation on a Phos-tag gel. N-L223/227E mutant serves as control for un-phosphorylated N.

