Figure 1.
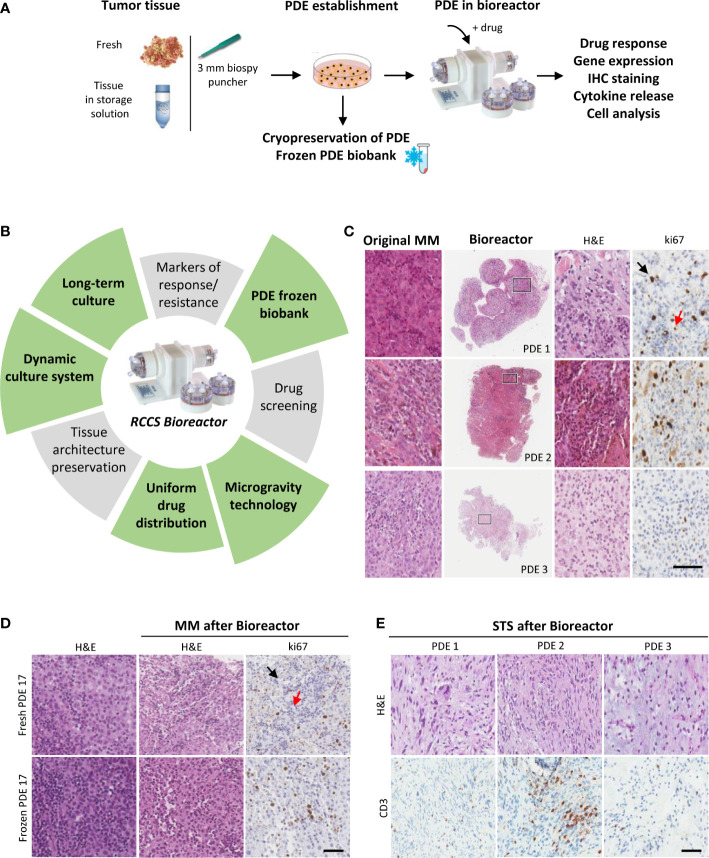
Dynamic 3D culture of PDE in RCCS Bioreactor preserves TIME architecture of MM and STS. (A) Strategy to establish tumor PDE to evaluate drug effects after culture in Bioreactor. (B) Main features common of PDE cultures (grey sectors) and those specific of PDE cultured in RCCS Bioreactor (green sectors). (C) Representative histological images of MM PDE after 3 days culture in Bioreactor compared to the original tumors. Right panels show higher magnification of the marked areas. (D) Representative images of ki67 stained fresh or frozen MM PDE before and after culture in Bioreactor. (E) Representative images of CD3 staining of frozen STS PDE after culture in Bioreactor. PDE 1: ckSTS, a myxofibrosarcoma of the extremities; PDE2: ckSTS, a retroperitoneal dedifferentiated liposarcoma; PDE 3: skSTS, a myxoid liposarcoma of the extremities. Ki67 staining of proliferating tumor cells and lymphocytes are indicated by black and red arrows, respectively. H&E, hematoxylin and eosin. Scale bar 80 μM (C), and 200 μM (D, E).

