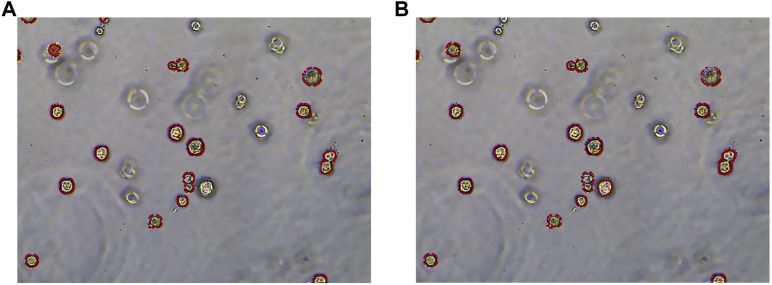
FIGURE 13.
Segmentation results of the RDAU-Net model compared with manual annotation. (A) Manual labeling of organoids. (B) RDAU-Net model labeling of organoids (the red markers indicate targeted organoids). The comparison between Figure 13A and Figure 13B shows that the result of our model labeling is already very close to that of manual labeling.

