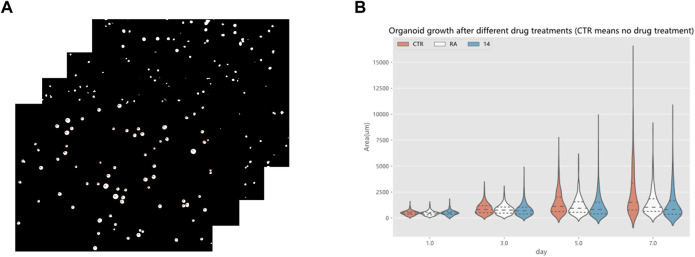
FIGURE 14.
Drug screening evaluation by the RDAU-Net model. (A) Area statistics of the organoid in the images (only a small part is shown here). (B) Violin plot shows the area changes of organoids in CTR, RA, and 14 groups at days 1, 3, 5 and 7. The area data statistics of the organoids of different treatments on the same day can clearly show the difference between the size of the organoids (adding a quartile distribution map, the dotted line in the middle indicates the median of the data in this group).

