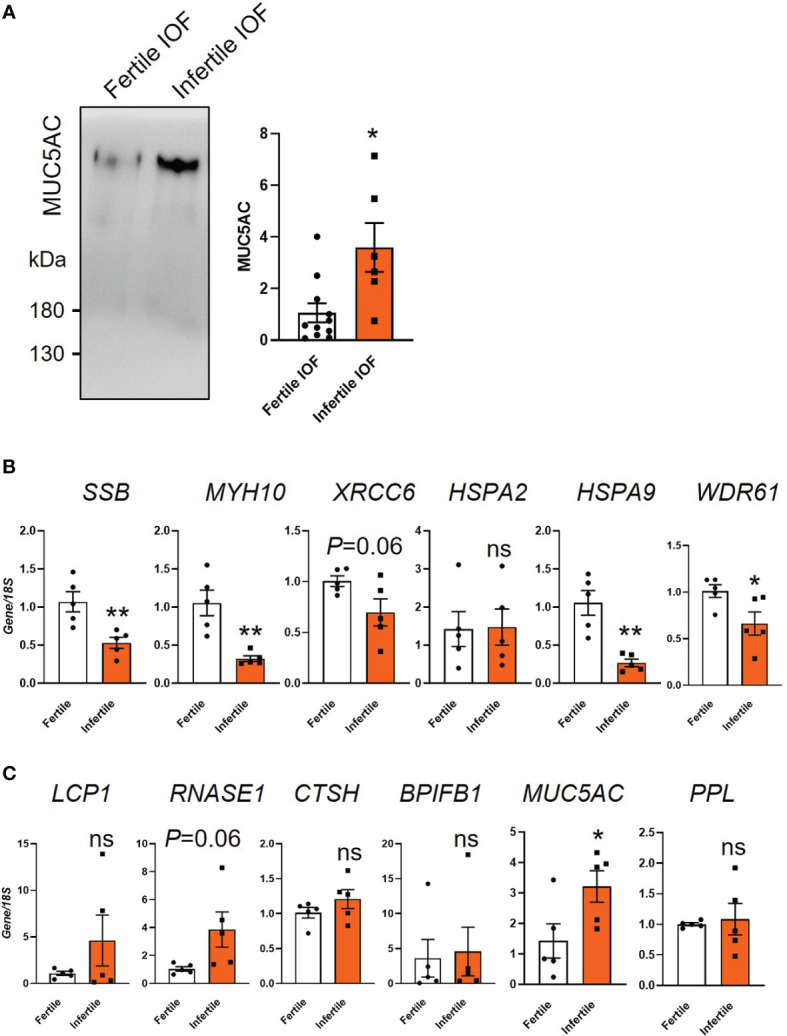
Figure 6.

Examination of candidate proteins identified by mass spectrometry. (A) Immunoblot validation of MUC5AC expression in fertile and infertile IOF. Equal amounts of protein were loaded for examination (n=6-11 biological replicates). (B, C) qPCR examination of the production of candidate proteins in organoid cells. Top 6 significantly decreased (B) and increased (C) proteins ranked by fold change in infertile IOF compared to fertile IOF were selected for analysis. Gene expression levels were normalized to 18S (n=5 biological replicates). All data were presented as mean ± SEM. *P<0.05, **P<0.01, ns, no significant difference; IOF, Intra-organoid fluid.
