
Figure. 5. GATA3 potentiates CRLF2-JAK-STAT signaling in hematopoietic cells.
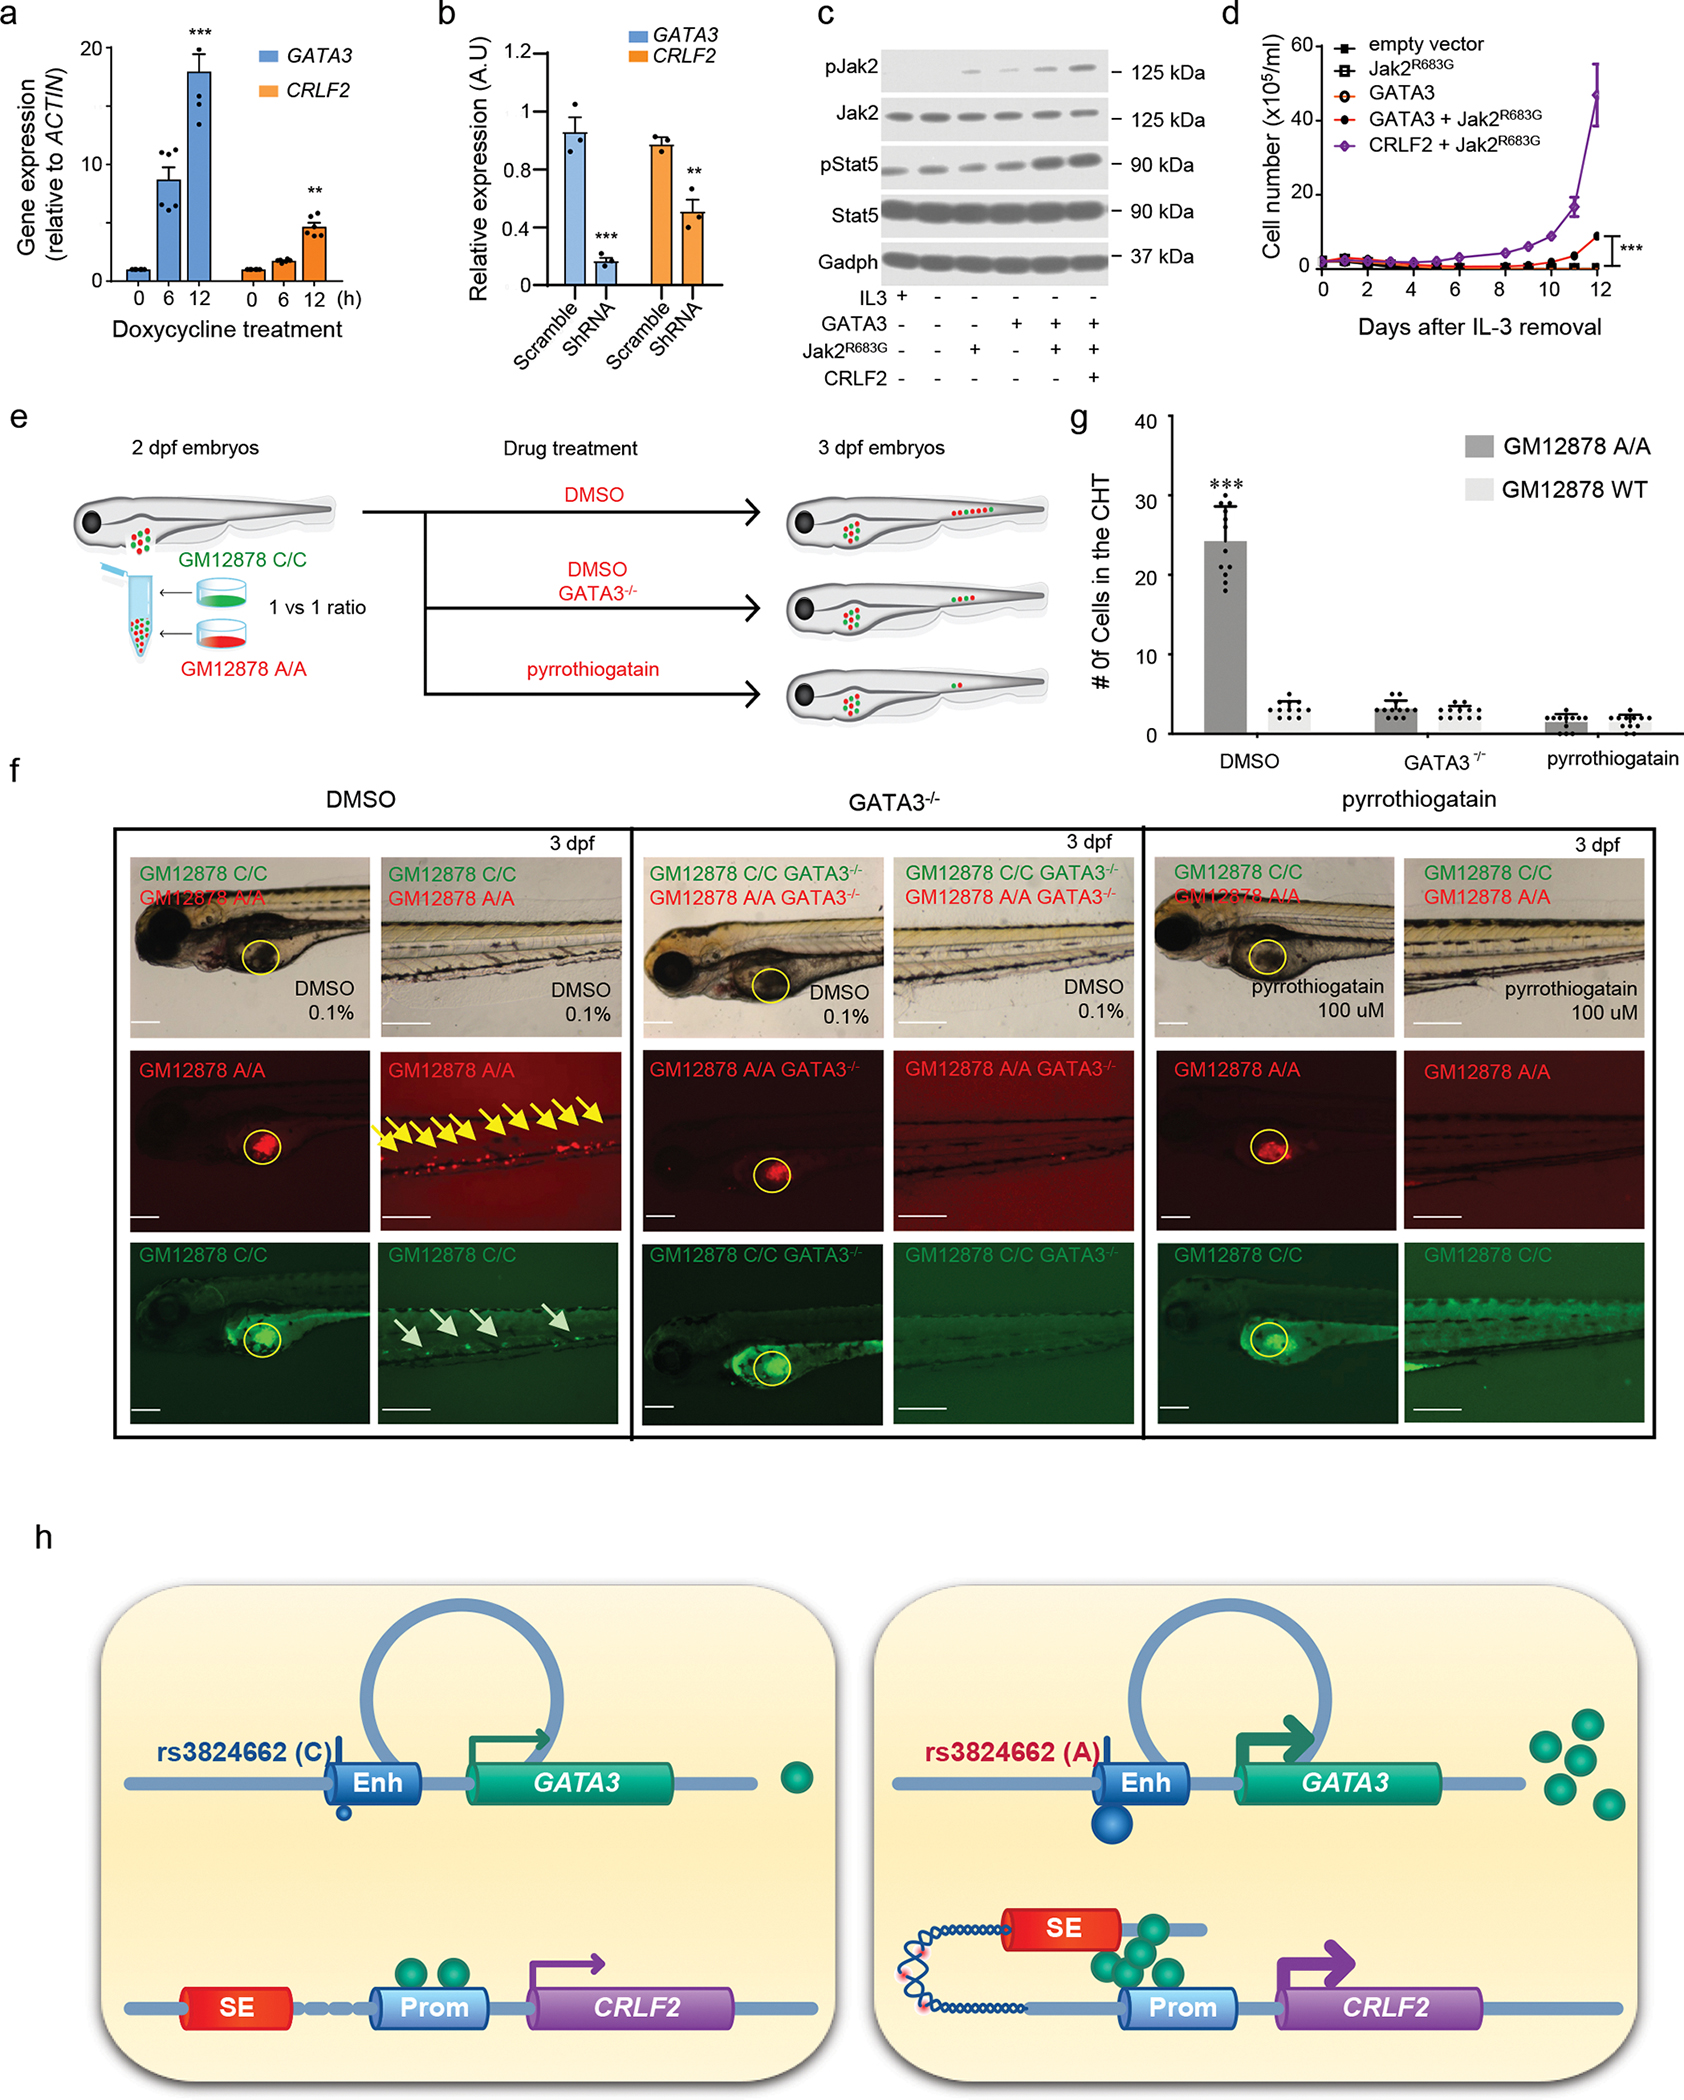
a-b, GATA3 regulates CRLF2 transcription in ALL cell line Nalm6 (overexpression in a and knockdown in b, n = 6 and 3, respectively); two-sided unpaired T test. In the GATA3 group, 12h vs. 0h p-value = 9.195e-05, scramble vs shRNA, p-value = 0.008203; in the CRLF2 group, 12h vs. 0h p-value = 0.0001296, scramble vs shRNA, p-value = 0.01786. Data are presented as mean values +/− SEM. c, JAK-STAT activation by GATA3 in mouse hematopoietic cell line Ba/F3. Cells were transduced with GATA3, JAK2R683G, and/or CRLF2 as indicated, and cultured in the presence or absence of IL3. JAK2 and STAT5 phosphorylation was examined by immunoblotting with GAPDH as control. Experiments were repeated three times with similar results. d, IL3-independent growth of Ba/F3 cells expressing GATA3, Jak2R683G, GATA3 with Jak2R683G, Jak2R683G with CRLF2, or empty vector. Experiments were performed in triplicates, p value < 0.001 by two-way ANOVA. Data are presented as mean values +/− SEM. e, Experimental design to evaluate the hematopoietic niche homing of GM12878 cells in zebrafish. f, Bright field and fluorescent imaging of 3dpf embryos with GM12878 injection. Yellow circle indicates injection sites. Yellow and green arrows indicate GM12878 A/A cells and WT cells homing to the caudal hematopoietic tissue (CHT), respectively. Scale bar: 200 uM. Experiments were repeated three times independently with similar results. g, Quantitative analysis of GM12878 cell homing to the CHT (n = 12), two-sided unpaired T test, p-value, from left to right, 1.446e-09, 0.2713, and 1. Data are presented as mean values +/− SEM. h, A schematic of our proposed model of how the rs3824662 variant contributes to Ph-like ALL pathogenesis. The A allele induces GATA3 expression which binds to the CRLF promoter and loops the CRLF2 promoter to the super enhancer at the P2RY8 locus, eventually resulting in CRLF2 overexpression. The chromatin region between the CRLF2 promoter and P2RY8 super enhancer also becomes more open and thus susceptible to damage (e.g., rearrangements). Enh: enhancer; SE: super-enhancer; Prom: promoter. For bar plots, *, ** and, *** represent p-value<0.01, p-value <0.001, and p-value<0.0001, respectively.