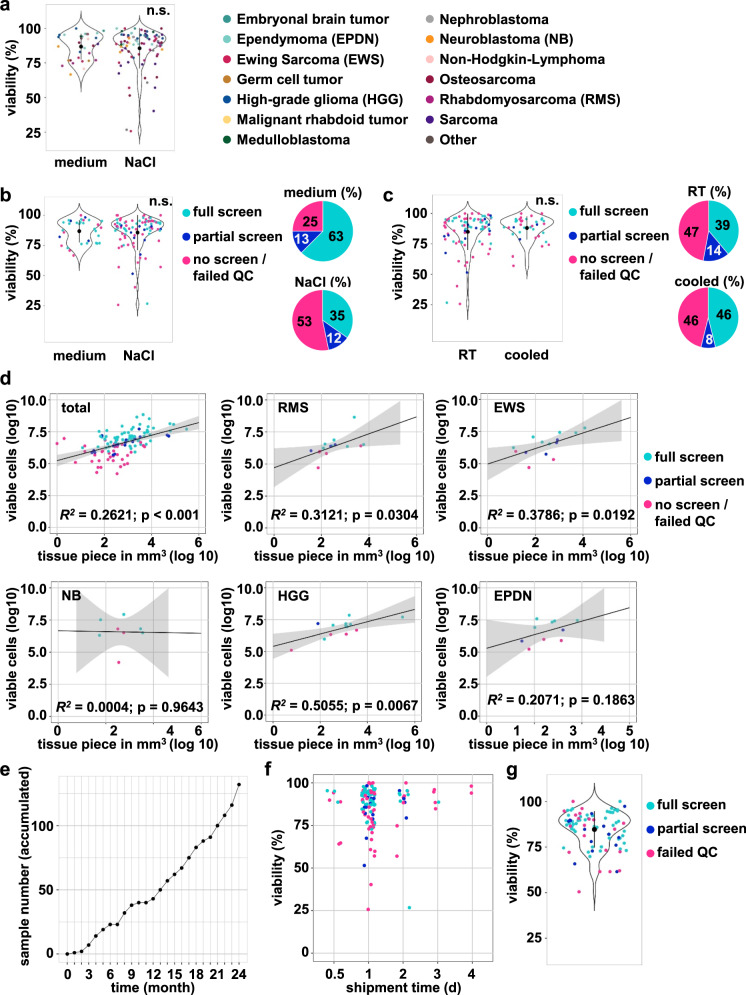
Fig. 2. Assessment of shipment conditions and tissue viability.
a Effect of sample shipment in 0.9% NaCl versus medium on sample viability, measured with automated viable and dead cell counting (ViCell or Cellometer). The color code on the right reflects the different tumor diagnoses. The black dots indicate the mean, error bars reflect SD. Students t-test (two-sided). b Violin plot: Effect of sample shipment in 0.9% NaCl versus cell culture medium on sample viability. Colors indicate screen type (full, meaning all three plates versus partial, meaning 1–2 plates versus no screen/screen that failed QC). The black dots indicate the mean, error bars reflect SD. Students t-test (two-sided). Pie diagrams: percentage of samples per screen type for samples shipped in 0.9% NaCl or medium. The color code in the middle reflects the screen type. c Violin plot: Effect of sample shipment at room temperature versus cooled on sample viability, with colors indicating the screening type. The black dots indicate the mean, error bars reflect SD. Students t-test (two-sided). Pie diagrams: percentage of samples per screening type for samples shipped at room temperature or code. The color code in the middle reflects the screen type. d Correlation plots calculated after log10 transformation comparing the volume of tissue piece to the viable cell number and the type of screen (full, meaning all three plates versus partial, meaning 1–2 plates versus no screen/screen (full or partial) that failed QC). The gray area represents the confidence intervals. Not all samples are displayed as volume or cell number data were not always available. Statistical method: Pearson correlation with R. e Accumulated incoming sample number of the two-year pilot phase (n = 132). f Effect of transport duration on sample viability, measured with automated viable and dead cell counting (ViCell or Cellometer). The color code reflects the tumor diagnoses as in panel b). g Viability at DSP seeding. The color code reflects the type of screen (full, meaning all three plates versus partial, meaning 1–2 plates versus screen that failed QC). The black dots indicate the mean, error bars reflect SD. EPDN ependymoma, EWS Ewing sarcoma, NB neuroblastoma, HGG high-grade glioma, RMS rhabdomyosarcoma. n.s.: not significant.

