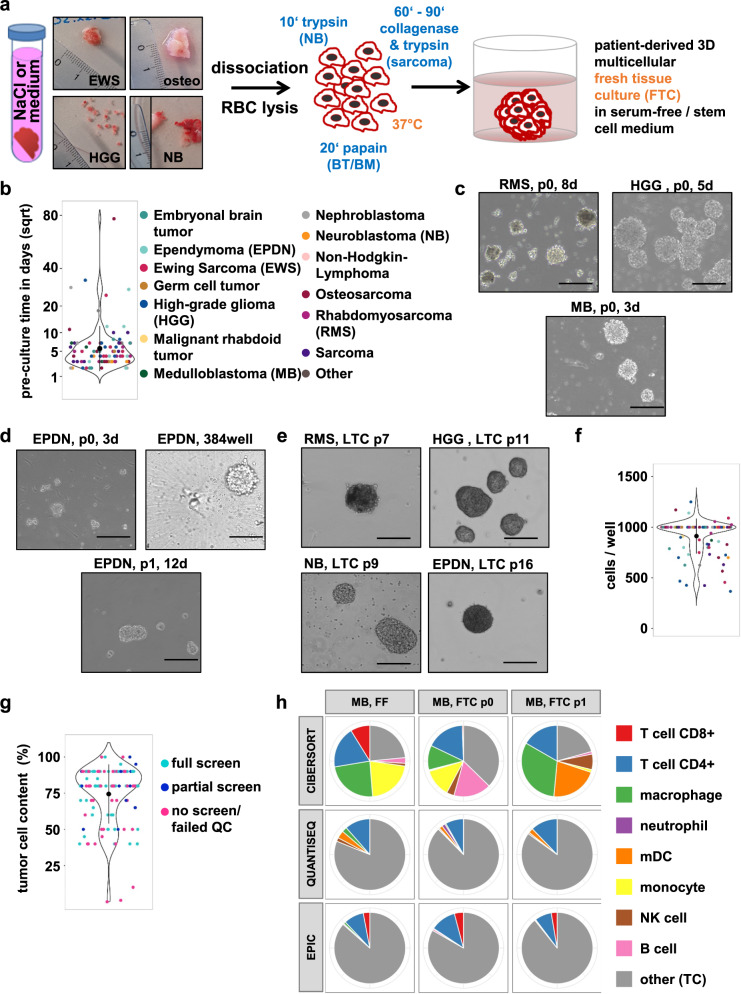
Fig. 3. Dissociation of tumor tissue and characterization of the patient-derived 3D culture models.
a Workflow of incoming tissue processing until the generation of patient-derived 3D multicellular fresh tissue culture (FTC). b Violin dot depicting the preculture time of screened samples in days; the y-axis is square-root transformed (sqrt) to better illustrate the distribution of all data points. The color code reflects the different tumor diagnoses (same as in d). The black dots indicate the mean, error bars reflect SD. c Bright field images (×10 magnification, cropped) for patient-derived 3D FTC precultures (d3, d5, d8) at passage 0. d Bright-field image (×10 magnification, cropped) for a patient-derived 3D culture from the same ependymoma (EPDN) sample at p0 (d3), at drug screen (384-well) and p1. e Bright-field images (×10 magnification, cropped) for patient-derived 3D long-term cultures (>p6, LTC). f Violin dot plot displaying the seeding cell number per well of the screened samples. The color code on the right reflects the different tumor diagnoses. The black dots indicate the mean, error bars reflect SD. g Violin dot plot illustrating the tumor cell content (in percent) of fresh frozen material accompanying the fresh tumor specimen submitted for DSP. The color code reflects the screening type (full, meaning all three plates versus partial, meaning 1–2 plates versus no screen/screen that failed quality control (QC)). The black dots indicate the mean, error bars reflect SD. h Immune cell type deconvolution results from the same medulloblastoma (MB) sample from FF (fresh frozen; original tumor), at p. 0 (directly after dissociation) and p. 1 (seeding time-point) with the most commonly used bulk RNA-seq deconvolution tools: CIBERSORT, QuantiSeq, and EPIC. TC tumor cell.

