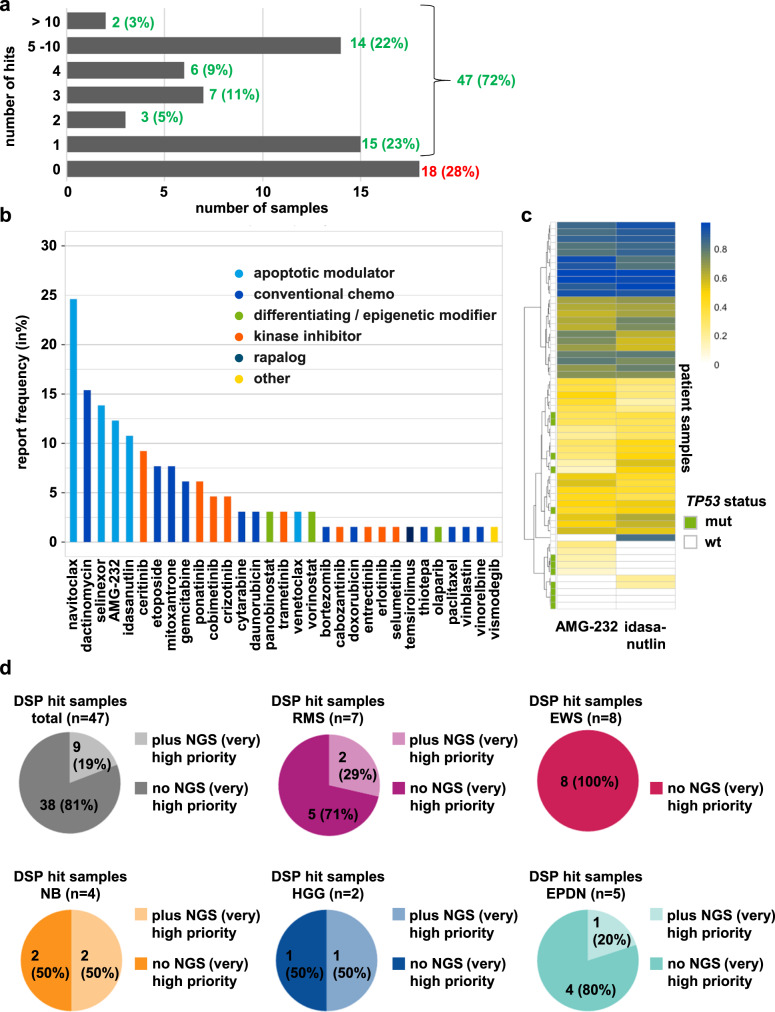
Fig. 6. Identified drug hits reported to the INFORM molecular tumor board.
a Bar diagram displaying the number of reported hits per sample and in %. b Bar diagram depicting the report frequency (in %) of single drugs and drug classes. Color code integrated. c Unsupervised hierarchical clustering based on DSSasym quantiles for the MDM2 inhibitors AMG-232 and idasanutlin. The color scale shown at the top represents quantile values. The TP53 status is highlighted with green (mutant) and white (wild-type) bars on the left side. d Pie diagrams reflecting the proportion of samples with reported hits with or without reported NGS (very) high-evidence targets for the total DSP cohort and different diagnoses.

