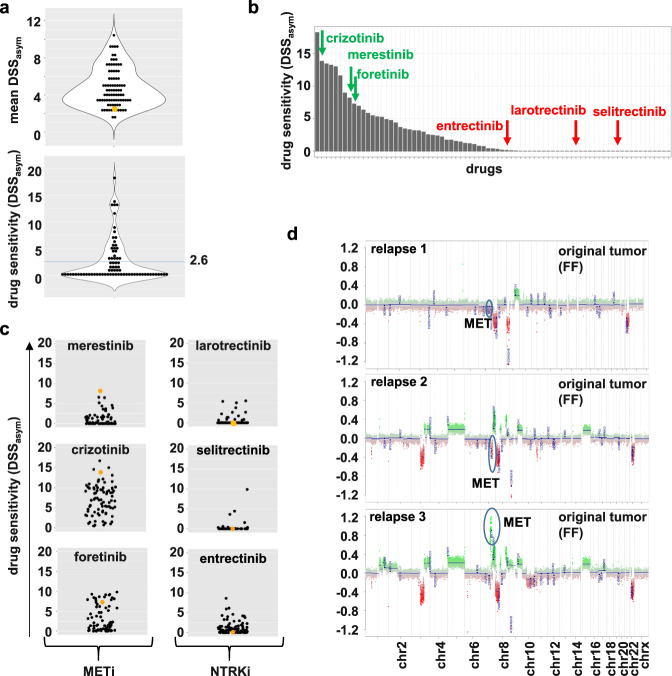
Fig. 7. Case report #1: NTRK fusion-positive high-grade glioma with acquired resistance to NTRKinhibitors due to MET amplification.
a Violin dot plots displaying the mean DSSasym values for the whole cohort (upper graph) and each drug for the respective sample (lower graph; blue line: mean). The sample of interest (here, case #1 relapse 3) is marked in orange. b Waterfall plot sorting all tested drugs for the case #1 relapse 3 sample upon their DSSasym values, starting with the highest on the left. c Dot plots depicting the DSSasym values for the indicated drugs for all successfully screened samples. The sample of interest (here, case #1 relapse 3) is marked in orange. All three MET inhibitors (merestinib, crizotinib, foretinib) show above-average responses, whereas the three NTRK inhibitors all have a DSSasym of or close to 0. d Copy-number profiles of the FF samples reveal an acquired (or selected) MET amp in the plot for relapse 3.

