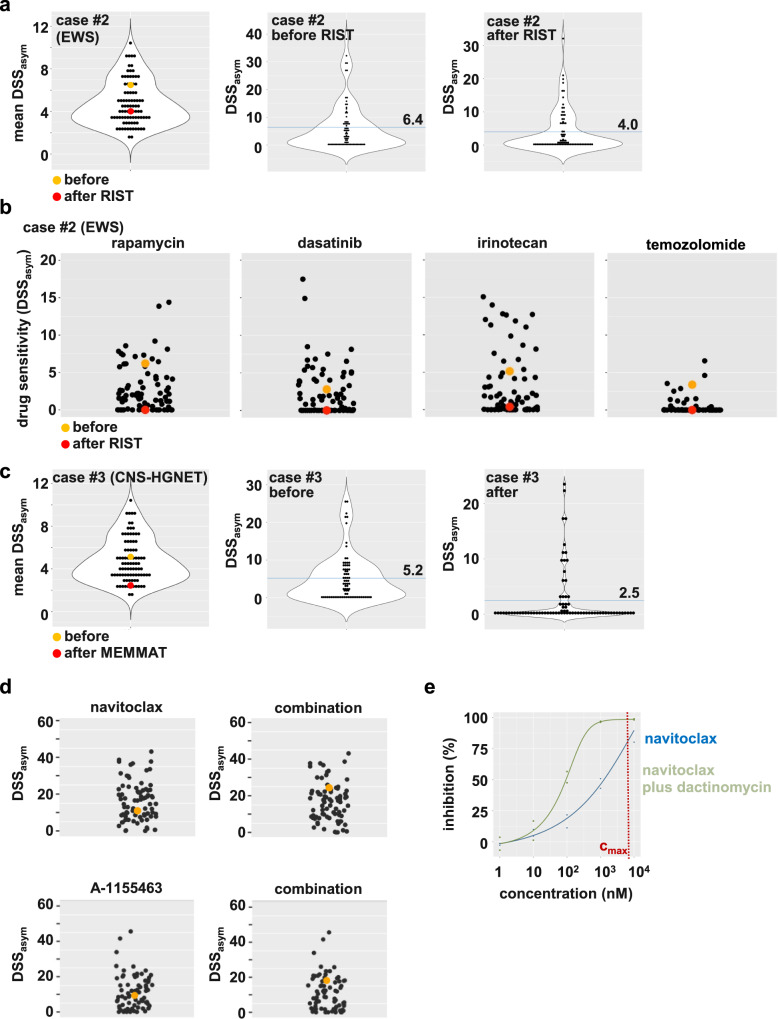
Fig. 8. Case reports #2 and #3: Evolution of treatment-associated drug resistance in serial sample collections.
a Violin dot plots of case #2, a relapsed EWSR1:FLI1-positive Ewing sarcoma (EWS) before and after RIST therapy. The dot plots display the mean DSSasym values for the whole cohort (left) and each drug for the respective sample before RIST treatment (middle) and after RIST treatment (right). The sample of interest before RIST is marked in orange, and the sample after RIST is marked in red. The blue line represents the mean. b Drug dot plots depicting the DSSasym values for the indicated drugs for all successfully screened samples. The sample of interest before RIST is marked in orange, and the sample after RIST is marked in red. All four drugs displayed a strong decrease in DSSasym after RIST therapy. c Violin dot plots of case #3, a relapsed CNS-HGNET brain tumor. Shown are DSP 1 and DSP 2 before and after MEMMAT therapy. The dot plots display the mean DSSasym values for the whole cohort (left) and each drug for the respective case (DSP 1 in the middle; DSP 2 on the right). The sample of interest DSP1 before MEMMAT is marked in orange, and DSP2 after MEMMAT is marked in red. The blue line represents the mean. d Drug dot plots depicting the DSSasym values for the single treatment (navitoclax or BCL-XL inhibitor A-1155463) and the combination (navitoclax plus dactinomycin or A-1155463 plus dactinomycin). The sample of interest (case #3, CNS-HGNET) is marked in orange. e Dose-response curves of a single compound (navitoclax) and combinatorial treatment (navitoclax plus IC25 10 nM dactinomycin). The overlay of both curves, reflecting a shift in sensitivity upon combinatorial treatment, is depicted. The combination screen was performed with cryopreserved cells cultured for four days after thawing for drug testing. % inhibition: normalized inhibition of metabolic activity.

