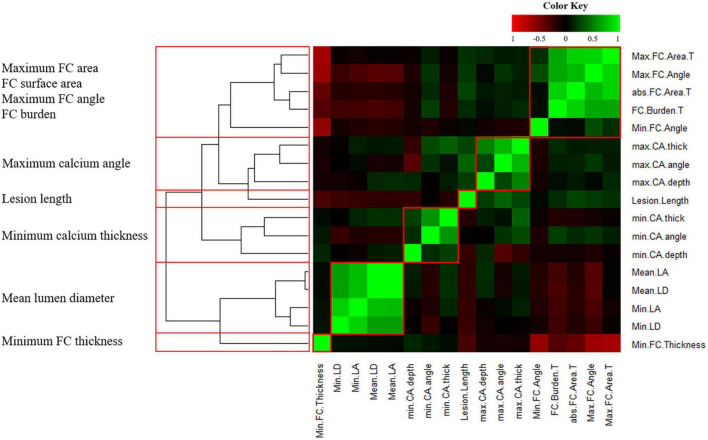
FIGURE 3.
Heatmap of 17 intravascular optical coherence tomography (IVOCT) plaque features with hierarchical clustering. R2 values are plotted against each other and ordered to show the statistically different clusters (red boxes). The color key indicates the value of explained variances: R2 values<0.5 are black, whereas greater values are shown in green or red with increasing intensity. Six clusters (red boxes) identified by hierarchical clustering and the IVOCT plaque features with the smallest p-values are shown on the left. Using a Spearman correlation coefficient threshold of 0.9, a total of 8 features were excluded from further analysis.

