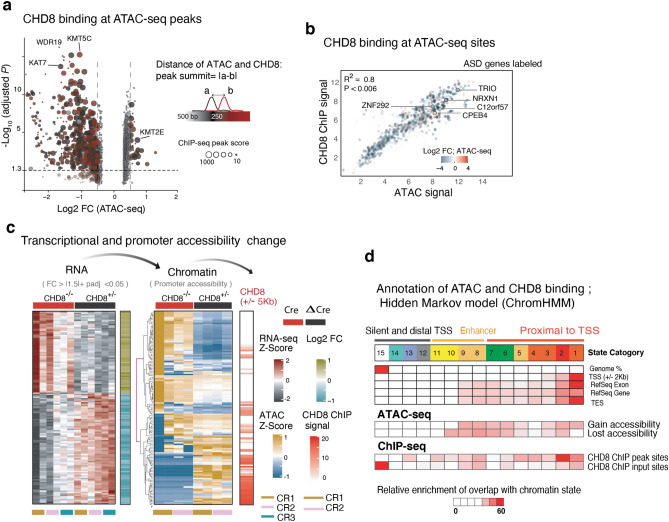
Figure 18.
CHD8 induces accessible chromatin at its direct chromatin targets. (a) Volcano plot depicting each ATAC-seq peak as one dot. The color indicates the distance of the ATAC-seq peak summit from the CHD8 peak summit at the immediate vicinity, and the size reflects the CHD8 ChIP-seq peak score. (b) Linear regression of DESeq2 normalized CHD8 binding signal and DE-seq2 normalized ATAC-seq signal at the promoters of genes with change accessibility, and example ASD genes are labeled. The color indicates log2 change of the accessibility in CHD8 KO. (c) Analysis of chromatin modification enrichment with ChromHMM and the annotation of the genomic feature with transition probability for 15 state model uncovers the distribution and the relative enrichment of CHD8 binding and the ATAC-seq sites across all chromatin states in neurons (GEO accessions used for this analysis listed in Supplementary Table 1). (d) RNA-seq and ATAC-seq signal for 136 genes with a significant change in gene expression and ATAC-seq signal in KO. CHD8 binding signal sorted with the same order of the sites of the promoters at the respective heatmap.

