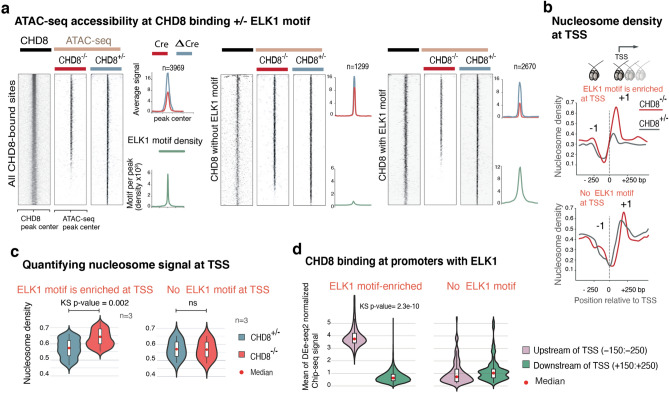
Figure 20.
CHD8 and ELK1 cooperate to regulate chromatin accessibility. (a) Normalized CHD8 signal and ATAC-seq signal in CHD8-KO and the control samples plotted, and ELK1 motif density plotted as a green enrichment plot. Genome-wide ChIP-seq and ATAC-seq signal divided into three groups: sites with exclusive enrichment for ELK1 motif, sites without ELK1 motif, and the control sites, which are the randomly shuffled peak sets from control samples. For each group, we compared the ATAC signal from KO to the control sample. (b) Cross-correlation analysis of ATAC-seq signal with NucleoATAC to measure nucleosome density. The enrichment plot is a subset of the calculated nucleosome density signal taken from TSS with ± ELK1 (ETS) motif (motif occurrence > 1). (c) Violin plots compare normalized and averaged nucleosome density signal at 100 bp region around the position + 1 of TSS with the presence or absence of ELK1 motif. Statistical analysis of distribution comparison is calculated with the Kolmogorov Smirnov test. (d) CHD8 binding signal taken from 100 bp upstream and downstream of transcription start sites (TSS), with the presence or absence of ELK1 motif.

