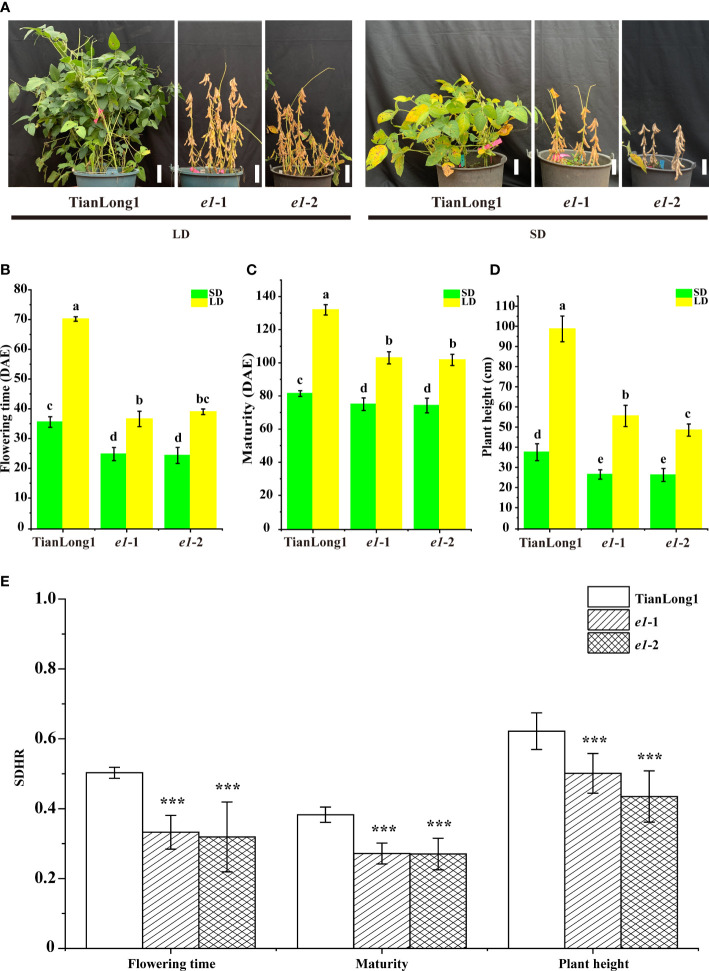
Figure 1.
CRISPR/Cas9-induced E1 mutant phenotypes under both LD and SD conditions. (A) Maturity of E1 mutants and wild-type TianLong1 under LD and SD conditions. Scale bar, 10 cm. (B) Flowering time. (C) Time to maturity. (D) Plant height. (E) Short-day hastening rate. All data is shown as the mean values ± standard deviation (n = 20 plants). The diverse lowercase letter above the histogram bars in (B–D) by Two-Way ANOVA, suggests significant differences between the two panels (P > 0.05). The error bars in (E) indicates standard deviation. ***P<0.001, as determined by one-tailed Student’s t-test. DAE, day after emergence.

