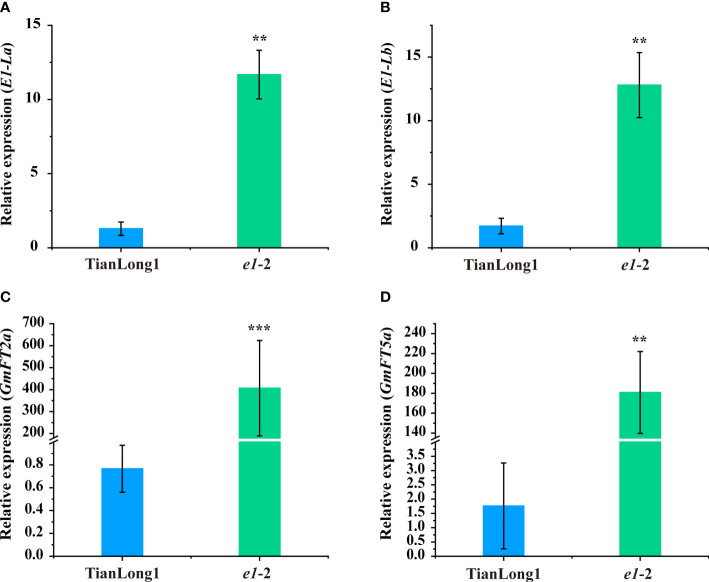
Figure 2.
Expression analyses of E1-Ls/GmFT2a/GmFT5a in WT plants and mutants under LD conditions. (A) Expression analysis of E1-La under LD conditions. (B) Expression analysis of E1-Lb under LD conditions. (C) Expression analysis of GmFT2a under LD conditions. (D) Expression analysis of GmFT5a under LD conditions. Transcript levels were normalized to TUA5. Values represent the means of three biological replicates (n = 3 plants); error bars indicate standard deviation. **P<0.01; ***P<0.001, as determined by one-tailed Student’s t-test.

