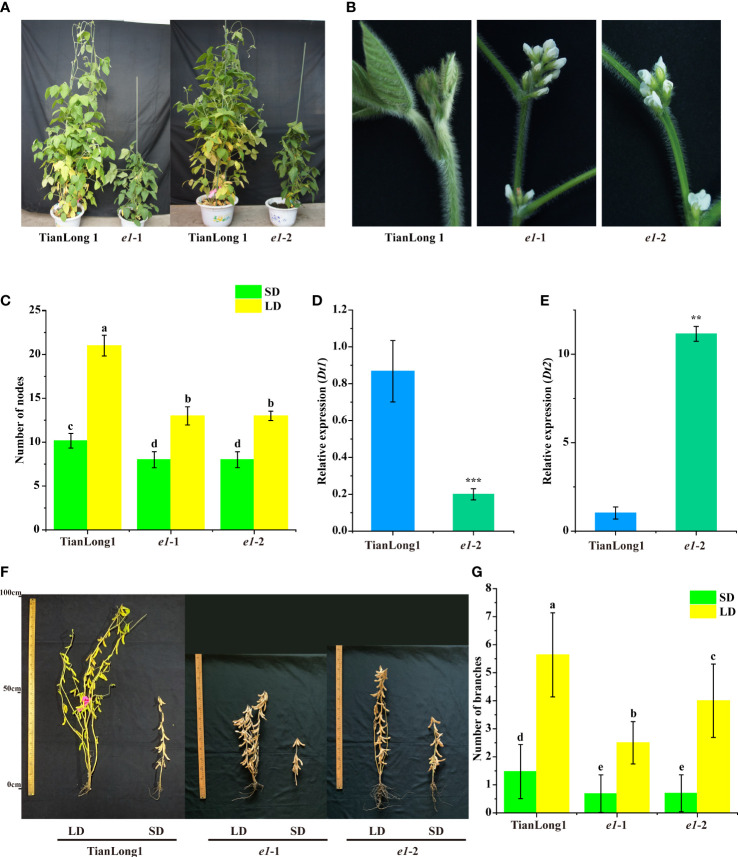
Figure 3.
Loss of E1 function changes the Stem Growth Habits of soybean. (A) Comparison of stem growth habit. (B) Morphology of the top of stems in determinate and indeterminate soybean. (C) Number of nodes. (D) Expression analysis of Dt1 under LD conditions. (E) Expression analysis of Dt2 under LD conditions. (F) Phenotypes of E1 mutants and wild-type TianLong1 under LD and SD conditions. (G) Number of branches. Transcript levels were normalized to TUA5. Values represent the means of three biological replicates (n = 3 plants); error bars indicate standard deviation. **P<0.01; ***P<0.001, as determined by one-tailed Student’s t-test. All data is shown as the mean values ± standard deviation (n = 20 plants). The diverse lowercase letter above the histogram bars in (C and G) by Two-Way ANOVA, suggests significant differences between the two panels (P > 0.05).

