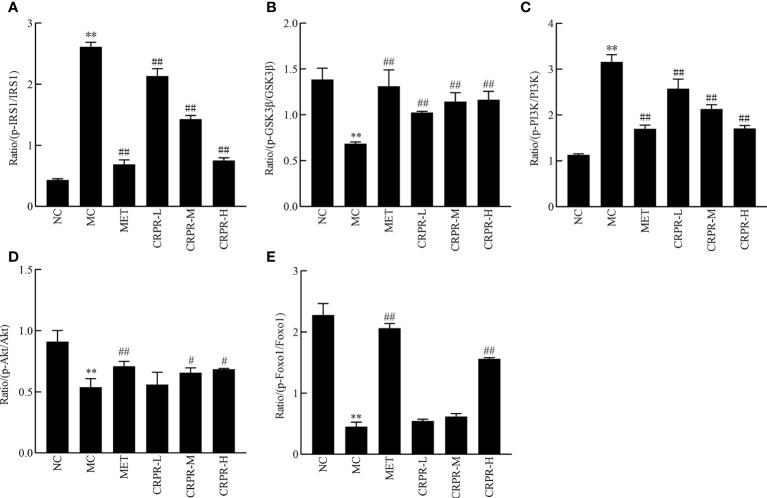
Figure 8.
The relative expression of p-IRS1/IRS1, p-GSK3β/GSK3β, p-PI3K/PI3K, p-Akt/Akt and p-FOXO1/FOXO1. The bar graphs show the effects of CRPR on the (A) p-IRS1/IRS1, (B) p-GSK3β/GSK3β, (C) p-PI3K/PI3K, (D) p-Akt/Akt and (E) p-FOXO1/FOXO1 ratios. All values are presented as the mean ± SD. **P < 0.01 vs. the NC group; # P<0.05 and ## P < 0.01 vs. the MC group.

