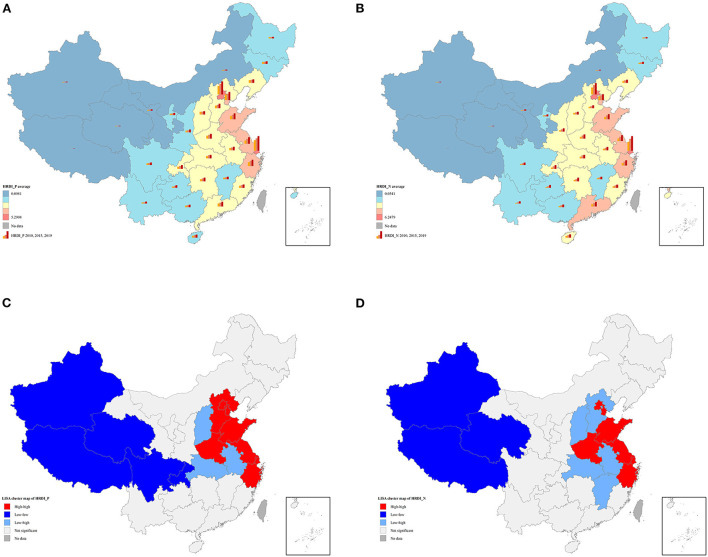
Figure 2.
(A) Spatial distribution of HRDI_P; (B) spatial distribution of HRDI_N; (C) univariate local indicator of spatial association cluster map of HRDI_P in 2019; (D) univariate local indicator of spatial association cluster map of HRDI_N in 2019. The average value of HRDI_P and HRDI_N in (A,B) was divided into five levels based on natural breaks (Jenks). These figures are drawn based on the standard map from the Resource and Environment Science and Data Center (https://www.resdc.cn/Default.aspx).

