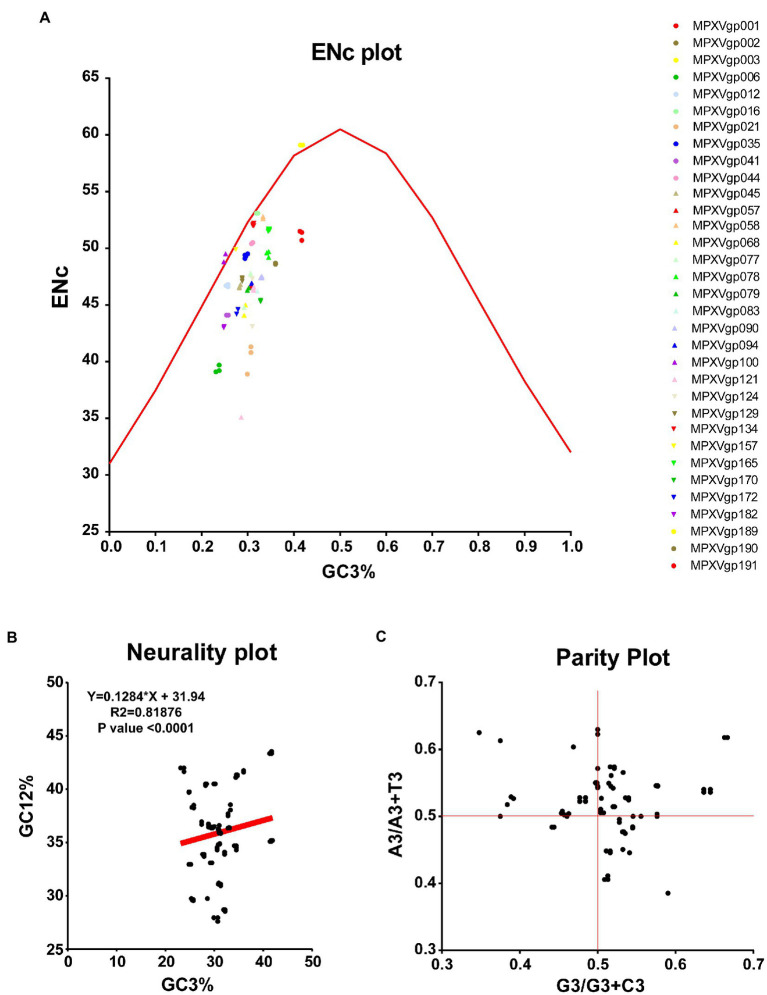
Figure 5.
Selection and mutation pressure determining indices. (A) ENc-GC3s plot values for genes that displayed mutations in the Clade IIb-B.1lineages of viruses compared with NC_063383.1/ MT903340.1. More than 1,000 sequences from different lineages in Clade IIb were used, and details are provided in Supplementary Data S1. The ENc-GC3 values of each gene are given in Supplementary Data S3. (B) Neutrality plot values for genes that displayed mutations in the Clade IIb-B.1lineages of viruses compared with NC_063383.1/ MT903340.1. More than 1,000 sequences from different lineages in Clade IIb were used, and details are provided in Supplementary Data S1. The Neutrality plot values of each gene are given in Supplementary Data S3. (C) Parity Rule 2 (PR2)-bias plot values for genes that displayed mutations in the Clade IIb-B.1lineages of viruses compared with NC_063383.1/ MT903340.1. More than 1,000 sequences from different lineages in Clade IIb were used, and details are provided in Supplementary Data S1. The PR2-bias values of each gene are provided in Supplementary Data S5.

