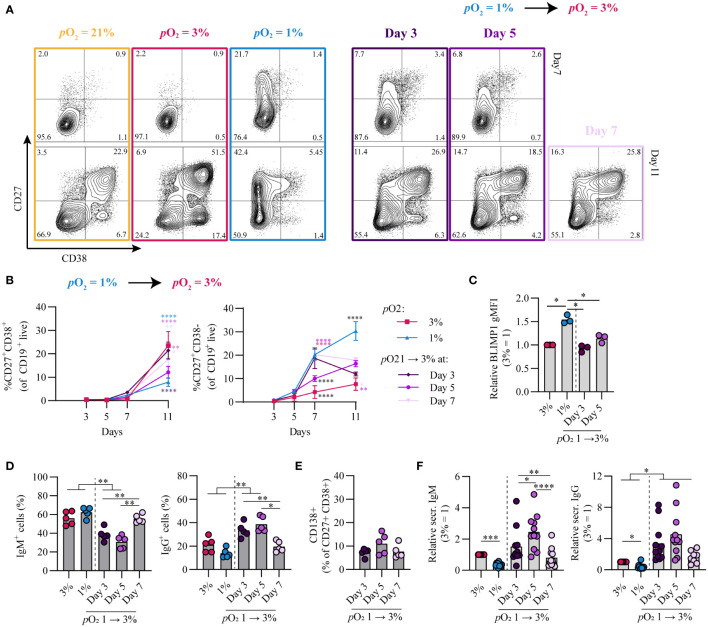
Figure 5.
Time-dependent pO2 transitions alter naive B cell differentiation and IgG class switch recombination. (A) Representative biaxial CD27/CD38 FACS plots of 21, 3, 1% pO2 cultures and 1 – 3% pO2 transition cultures at day 3, 5 or 7 shown for day 7 and 11 of culture. (B) Quantification of CD27+CD38+ and CD27+CD38- B cells over time in culture (n = 11) (C) gMFI of BLIMP1 on day 7 (n = 3) (D) Frequency of IgM+ and IgG+ B cells on day 11 (n = 5). (E) CD138 expression within the CD27+CD38+ population (n = 5). (F) IgM and IgG levels were measured by ELISA in culture supernantant after 11 days (n = 11). Bars represent means of biological replicates each composed of two technical replicates of (B, F) 3, (D) 2 or (C, E) 1 independent experiment. (B) Statistical differences were determined using mixed-effects analysis using Tukey’s test for multiple comparisons (C-F) Differences in gMFI, % gated cells and Ig production were determined using repeated measures one-way ANOVA using Tukey’s test for multiple comparisons. *p < 0.05, **p < 0.01, ***p < 0.001, ****p < 0.0001.

