Figure 2.
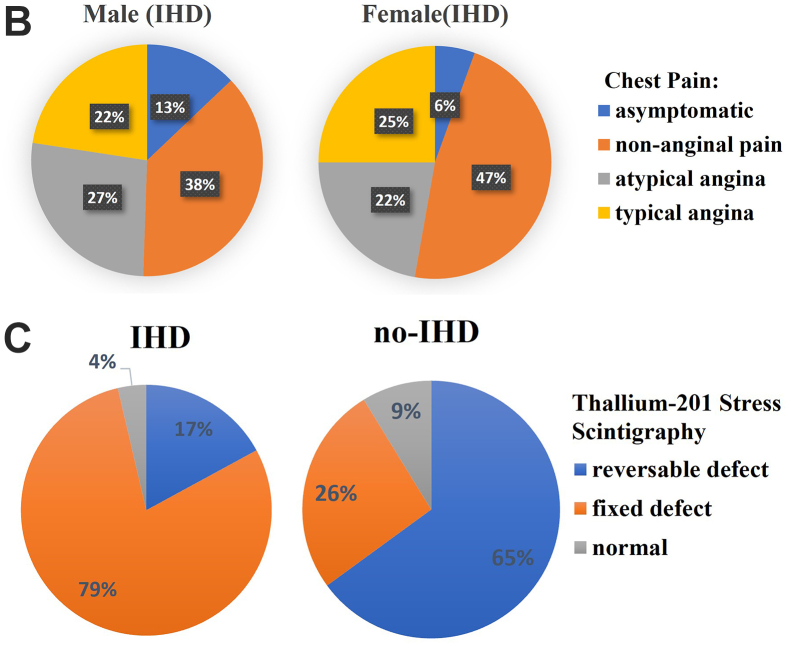
Data analysis and validation. A: Data distribution of maximum exercise heart rate achieved (thalach), cholesterol (chol), ST depression induced by exercise relative to rest (oldpeak), thallium-201 stress scintigraphy (thal) (1–3), slope of the peak exercise ST (1,2), and number of major vessels (0–3) colored by fluoroscopy (ca). B: Chest pain types for males and females with ischemic heart disease (IHD). C: Thallium-201 stress scintigraphy vs IHD.


