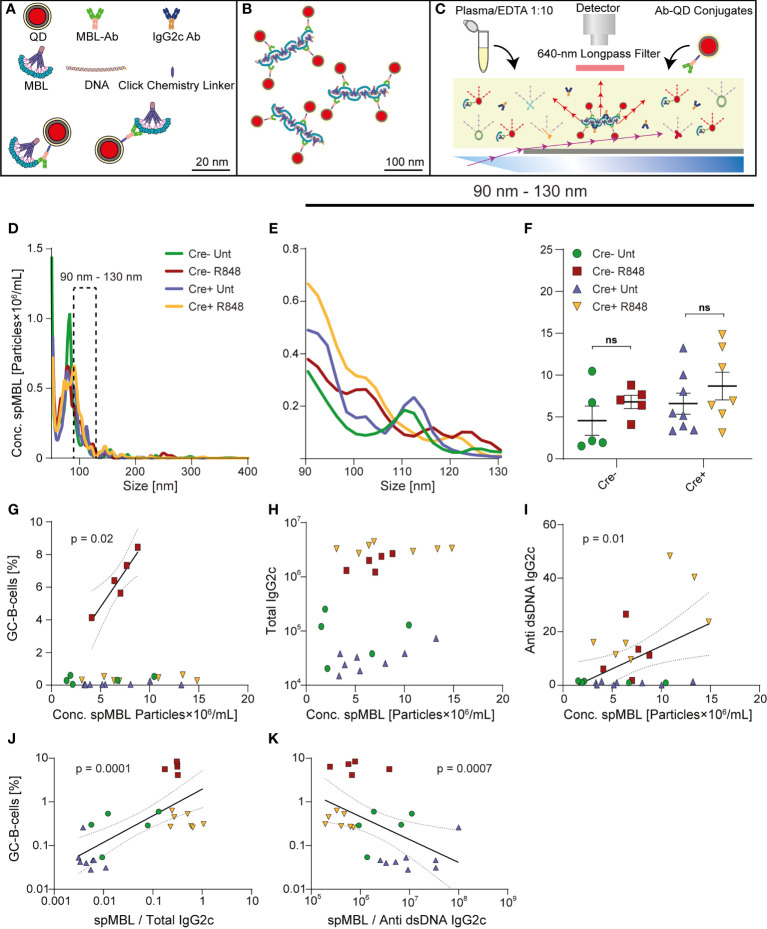
Figure 2.
Trend towards increased levels of spMBL particles in serum from Cre+ R848 treated mice, and GC and autoantibody correlations with spMBL. (A–C) Schematic overview of experimental setup for spMBL analysis of serum samples. (D) Samples were tested for the size interval 90-130 nm from Aicda-Cre Bcl-6flx/flx (Untreated: blue, R848-treated: yellow) and Bcl-6flx/flx littermate controls (Untreated: green, R848-treated: red). (E) Zoom onto the range of 90 to 130 nm. (F) Graph showing mean ± SEM and individual measurements across treatment protocols for Cre- untreated (n=5), Cre- R848-treated (n=5), Cre+ untreated (n=8), and Cre+ R848-treated (n=7) mice. (G) Correlation analysis of GCB vs. Conc. spMBL. (H) Correlation analysis of total IgG2c levels vs. Conc. spMBL. (I) Correlation analysis of anti-dsDNA IgG2c vs. Conc. spMBL. (J) Correlation analysis of GCB cells vs. spMBL/total IgG2c (K) Correlation analysis of GCB vs. spMBL/anti-dsDNA IgG2c. Two-way ANOVA with Holm-Sidak’s post hoc test was used to analyze the data in F. Linear regression models were used to analyze G-K. ns = p≥0.05.

