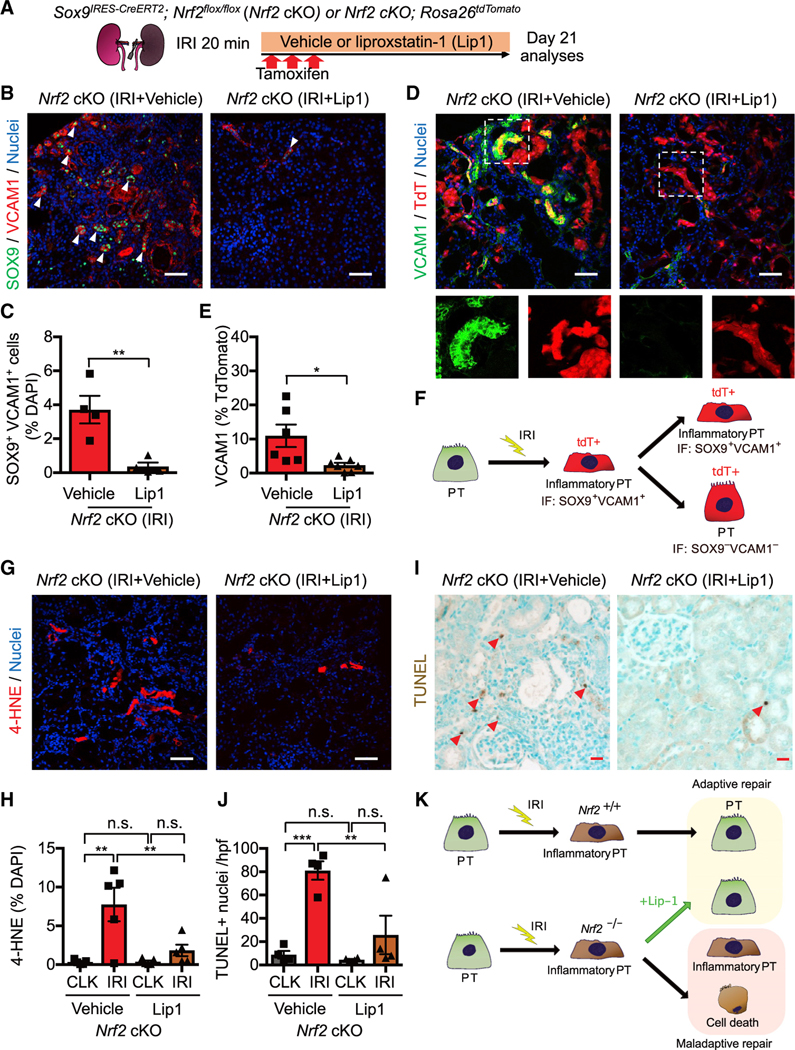
Figure 6. NRF2 governs PT cell fate and plasticity by mitigating ferroptotic stress.

(A) Experimental workflow for testing NRF2 function in regulating ferroptotic stress and ferroptosis. Nrf2 cKO mice were subjected to ischemic stress (20 min) and tamoxifen treatment. The same volume of liproxstatin-1 (Lip-1) or vehicle was intraperitoneally injected daily into the mice. Kidneys were harvested on day 21 post-IRI.
(B and C) Immunostaining for SOX9 and VCAM1. Representative images are shown. Arrowheads, SOX9+/VCAM1+ cells. Quantification is shown in (C). n = 4.
(D and E) Immunostaining for VCAM1 and fate mapping using tdTomato fluorescence. Sox9-lineage cells express tdTomato. Insets: individual fluorescence channels of the dotted box area. Quantification of VCAM1+ cells in Sox9-lineage cells is shown in (E). n = 6–7.
(F) Schematic model for PT cell state changes after IRI.
(G and H) Immunostaining for 4-HNE and its quantification. n = 5.
(I and J) TUNEL staining for evaluating cell death. Quantification of TUNEL+ cells is shown in (J). n = 4. Arrowheads, TUNEL+ cells.
(K) Schematic model. Nrf2 regulates PT cell fate by mitigating ferroptotic stress.
Student’s t test for (C) and (E) and one-way ANOVA with post hoc multiple comparisons test for (H) and (J). n.s., not significant. *p < 0.05; **p < 0.01; ***p < 0.001; ****p < 0.0001. Scale bars: 50 μm in (B), (D), and (G) and 20 μm in (I). Data are represented as mean ± SEM.
