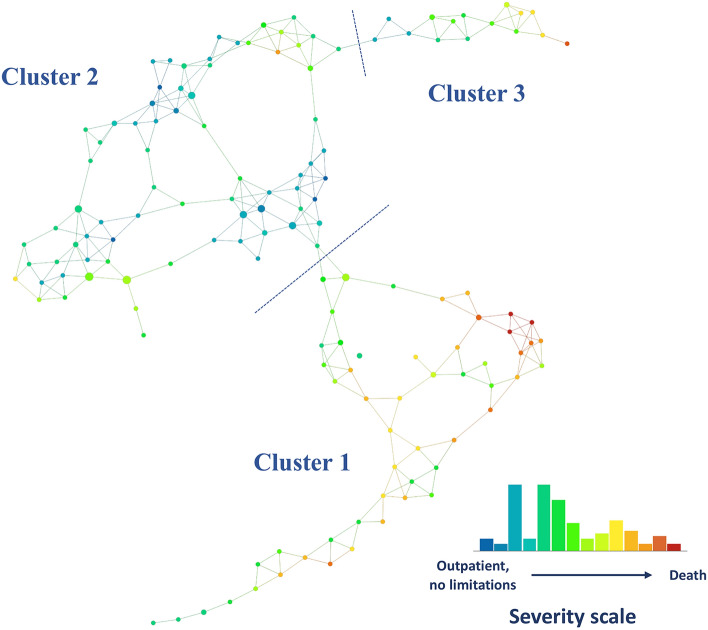
Figure 1.
Topological data analysis (TDA) network of protein expression during the middle-phase of COVID-19. Distinct protein expression phenotypes (Clusters 1, 2, and 3) were identified based on density and break points in the network and persistence of the clusters. Each node represents a combination of 12 plasma protein analyte levels and its size increases with the number of participants that are included. Edges (lines between nodes) indicate that patients are represented in more than one node. The network is colored by the average score on the disease severity scale (from outpatients without limitations [green] to death [red]) in each node. Analysis was performed on the EurekaAI Workbench (SymphonyAI, Los Altos, CA, USA).

