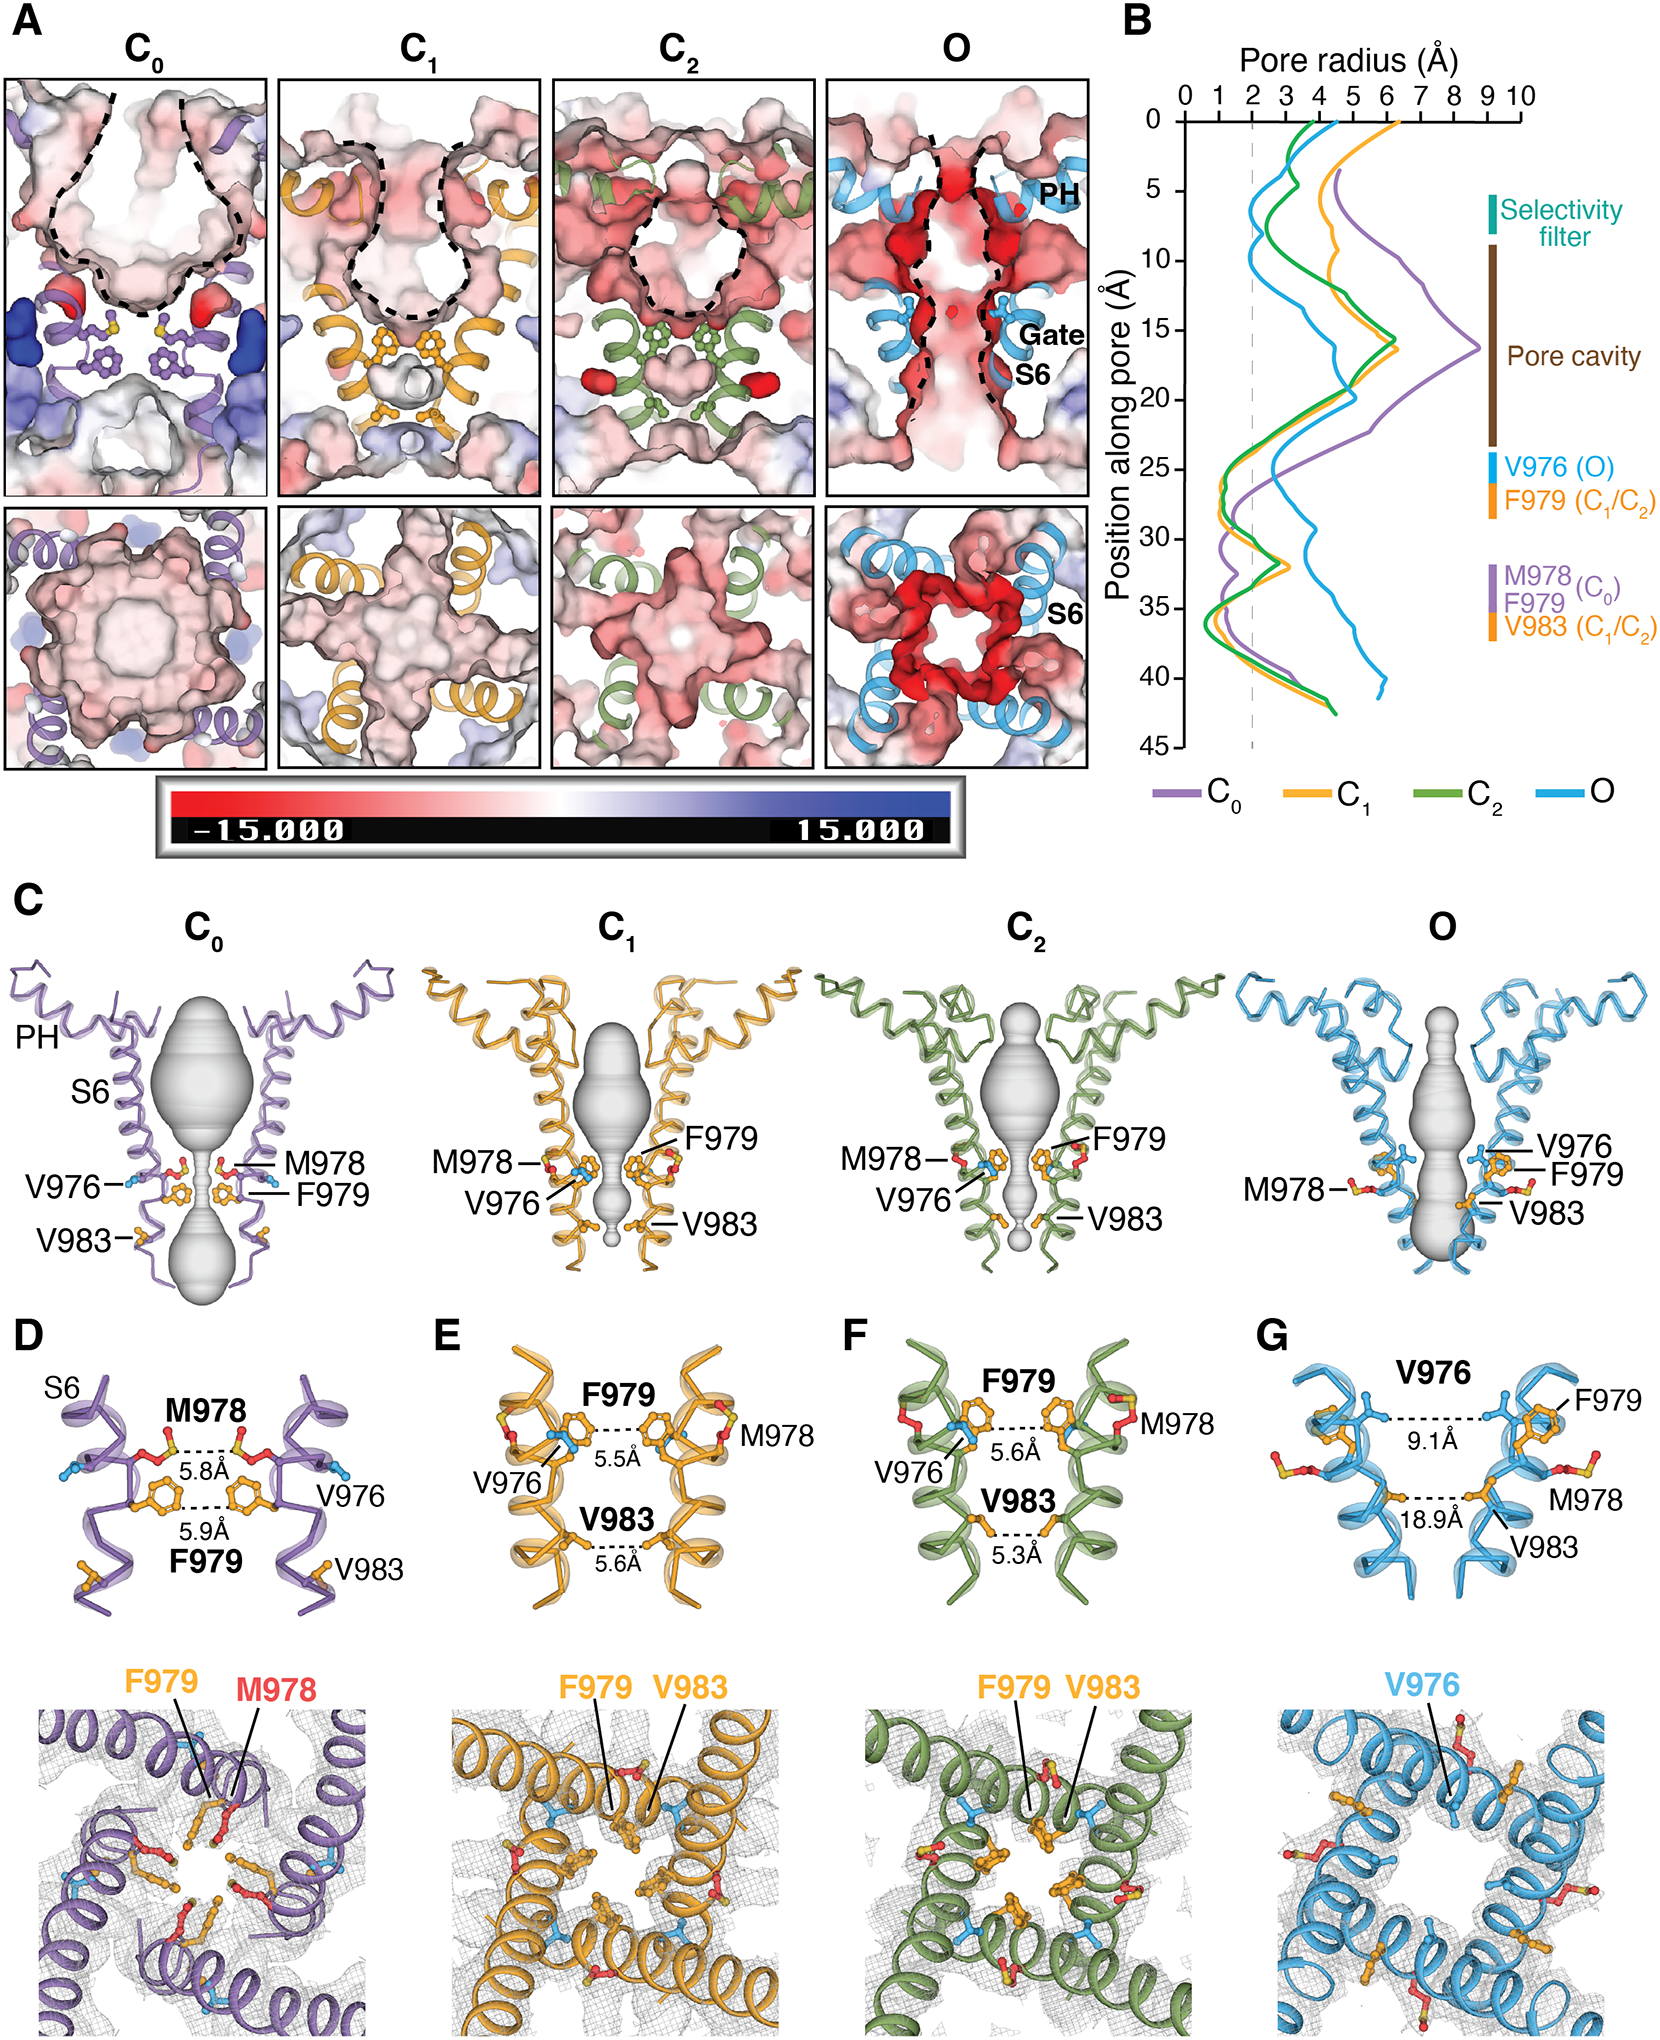
Figure 4. Structural changes in the pore domain and S6 gate position during gating.

(A) Viewed from the membrane plane (top) and from the extracellular side (bottom), electrostatic potential of the pore-lining surface in the C0, C1, C2, and O states, calculated by APBS (74) implemented in PyMOL. S6 helices are shown in cartoon and gating residues as sticks. The scale bar indicates electrostatics from −15 to +15 kT/e.
(B) Pore radii calculated using the HOLE program (75) as colored in (A) (see methods). Regions spanning the selectivity filter, pore cavity, and S6 gate in distinct conformation states are denoted. The dotted line denotes a 2.0 Å-radius.
(C) Ion permeation pathway in the C0, C1, C2, and O states shown as gray surfaces.
(D to G) Close-up views of the S6 gate from the membrane plane (top panels) and from the extracellular side (bottom panels) for the C0 state [(D) purple], C1 state [(E) orange], C2 state [(F) green], and O state [(G) blue]. Diagonal distances in Å between opposing gating residues are labeled in the top panels. Gray meshes represent EM densities at the S6 gate region, contoured at 0.19 (D), 0.16 (E), 0.16 (F), and 0.16 (G) thresholding, respectively. Gating residues are shown in sticks and colored red for Met978, orange for Phe979 and Val983, and blue for Val976. The apo-TRPM8MM (purple), PIP2-TRPM8MM (orange), PIP2-C3-TRPM8MM (green), and PIP2-C3-AITC-TRPM8MM (blue) structures are used for illustration and analysis.
