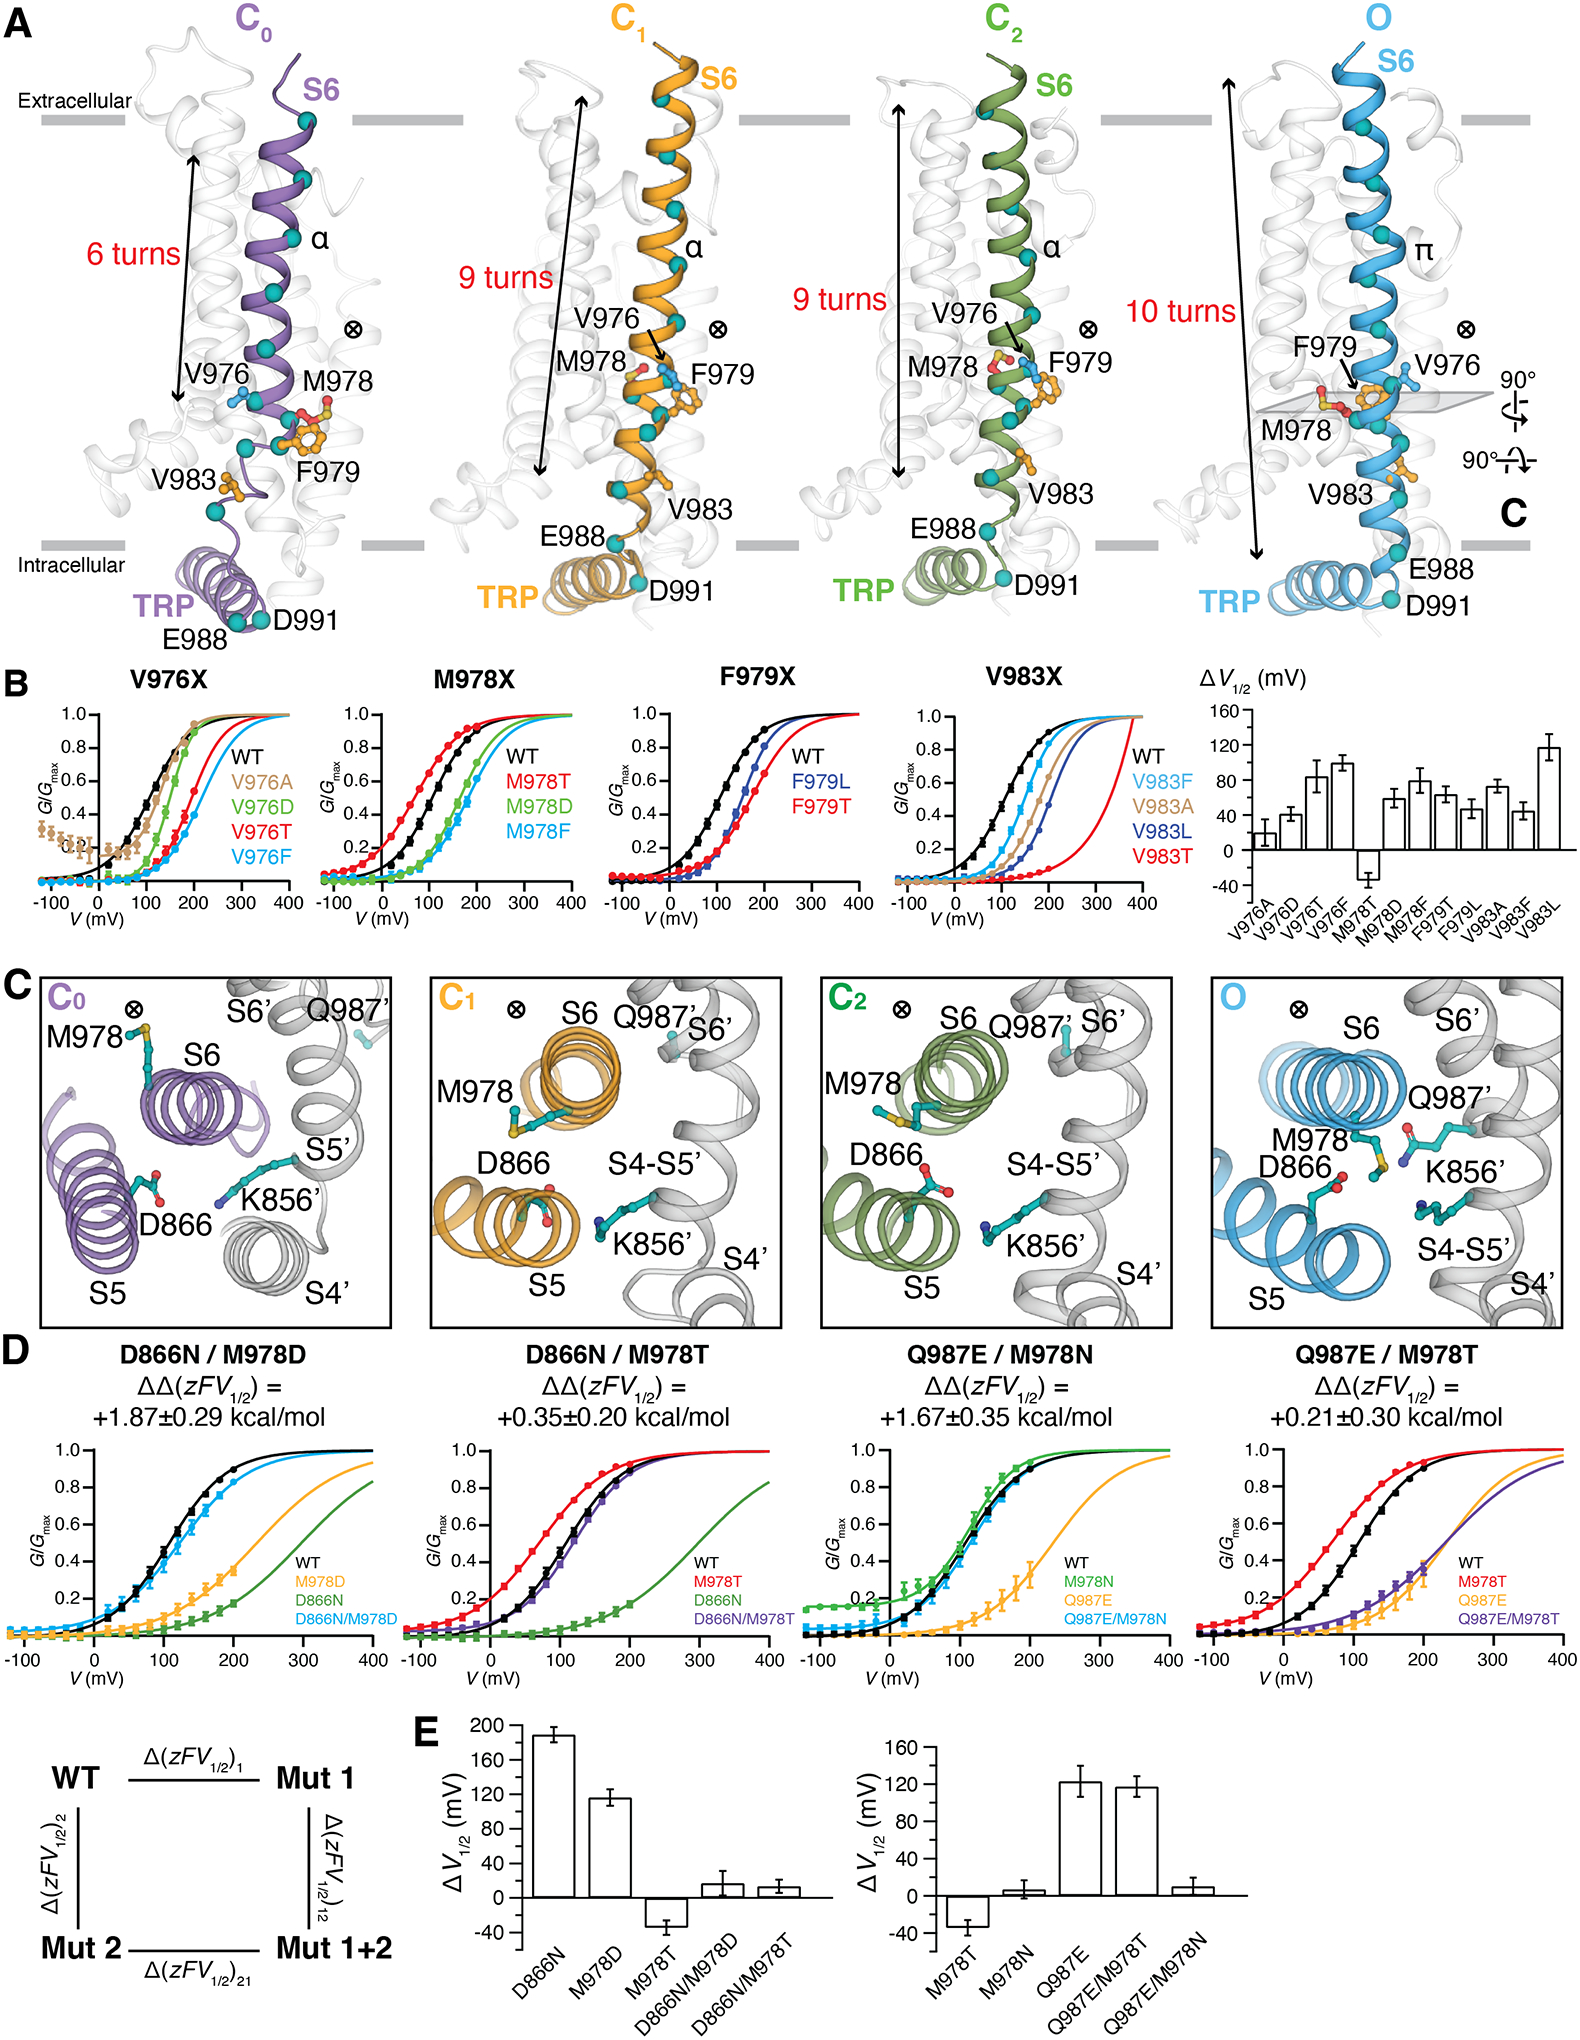
Figure 5. State-dependent interface in the O state of TRPM8MM.

(A) Side-by-side comparison of the S6 rearrangement in the C0, C1, C2, and O state structures viewed from the membrane plane. Gating residues are shown as sticks and colored as in Fig. 4. The ⨂ symbol next to the gate residue indicates the location of the pore. Teal colored spheres represent residues from every helical turn along S6. S1 to S5 and PH are colored transparent gray for clarity. Gray bars indicate the membrane bilayer position. The number of helical turns in S6 is denoted.
(B) G-V relationships of gating residue mutants. The data were fit with Boltzmann functions, with extrapolation to +400 mV. Bar chart (rightmost panel) quantifying the effect of mutations on the V1/2 of activation with respect to wildtype (ΔV1/2) as mean ± SEM (n = 4 to 11 oocytes). V1/2 of V983T is far right-shifted so its ΔV1/2 is omitted in the bar chart.
(C) Close-up extracellular view at the MDQK interface sliced from (A). Gray cartoon and (´) represent structural domains from the neighboring protomer. ⨂ indicates the location of the ion conduction pore.
(D) G-V relationship for the double mutant cycle analysis. G-V curves for D866N, M978D, Q987E, Q987E/M978T were obtained with Gmax values measured in the presence of menthol (fig. S14). Coupling energy ΔΔzFV1/2 (mean ± S.E.M.) was calculated using Equations #2 to #7 in methods.
(E) Bar chart quantifying the difference of V1/2 between mutant and wildtype (ΔV1/2) as mean ± S.E.M. (n = 4 to 11 oocytes).
