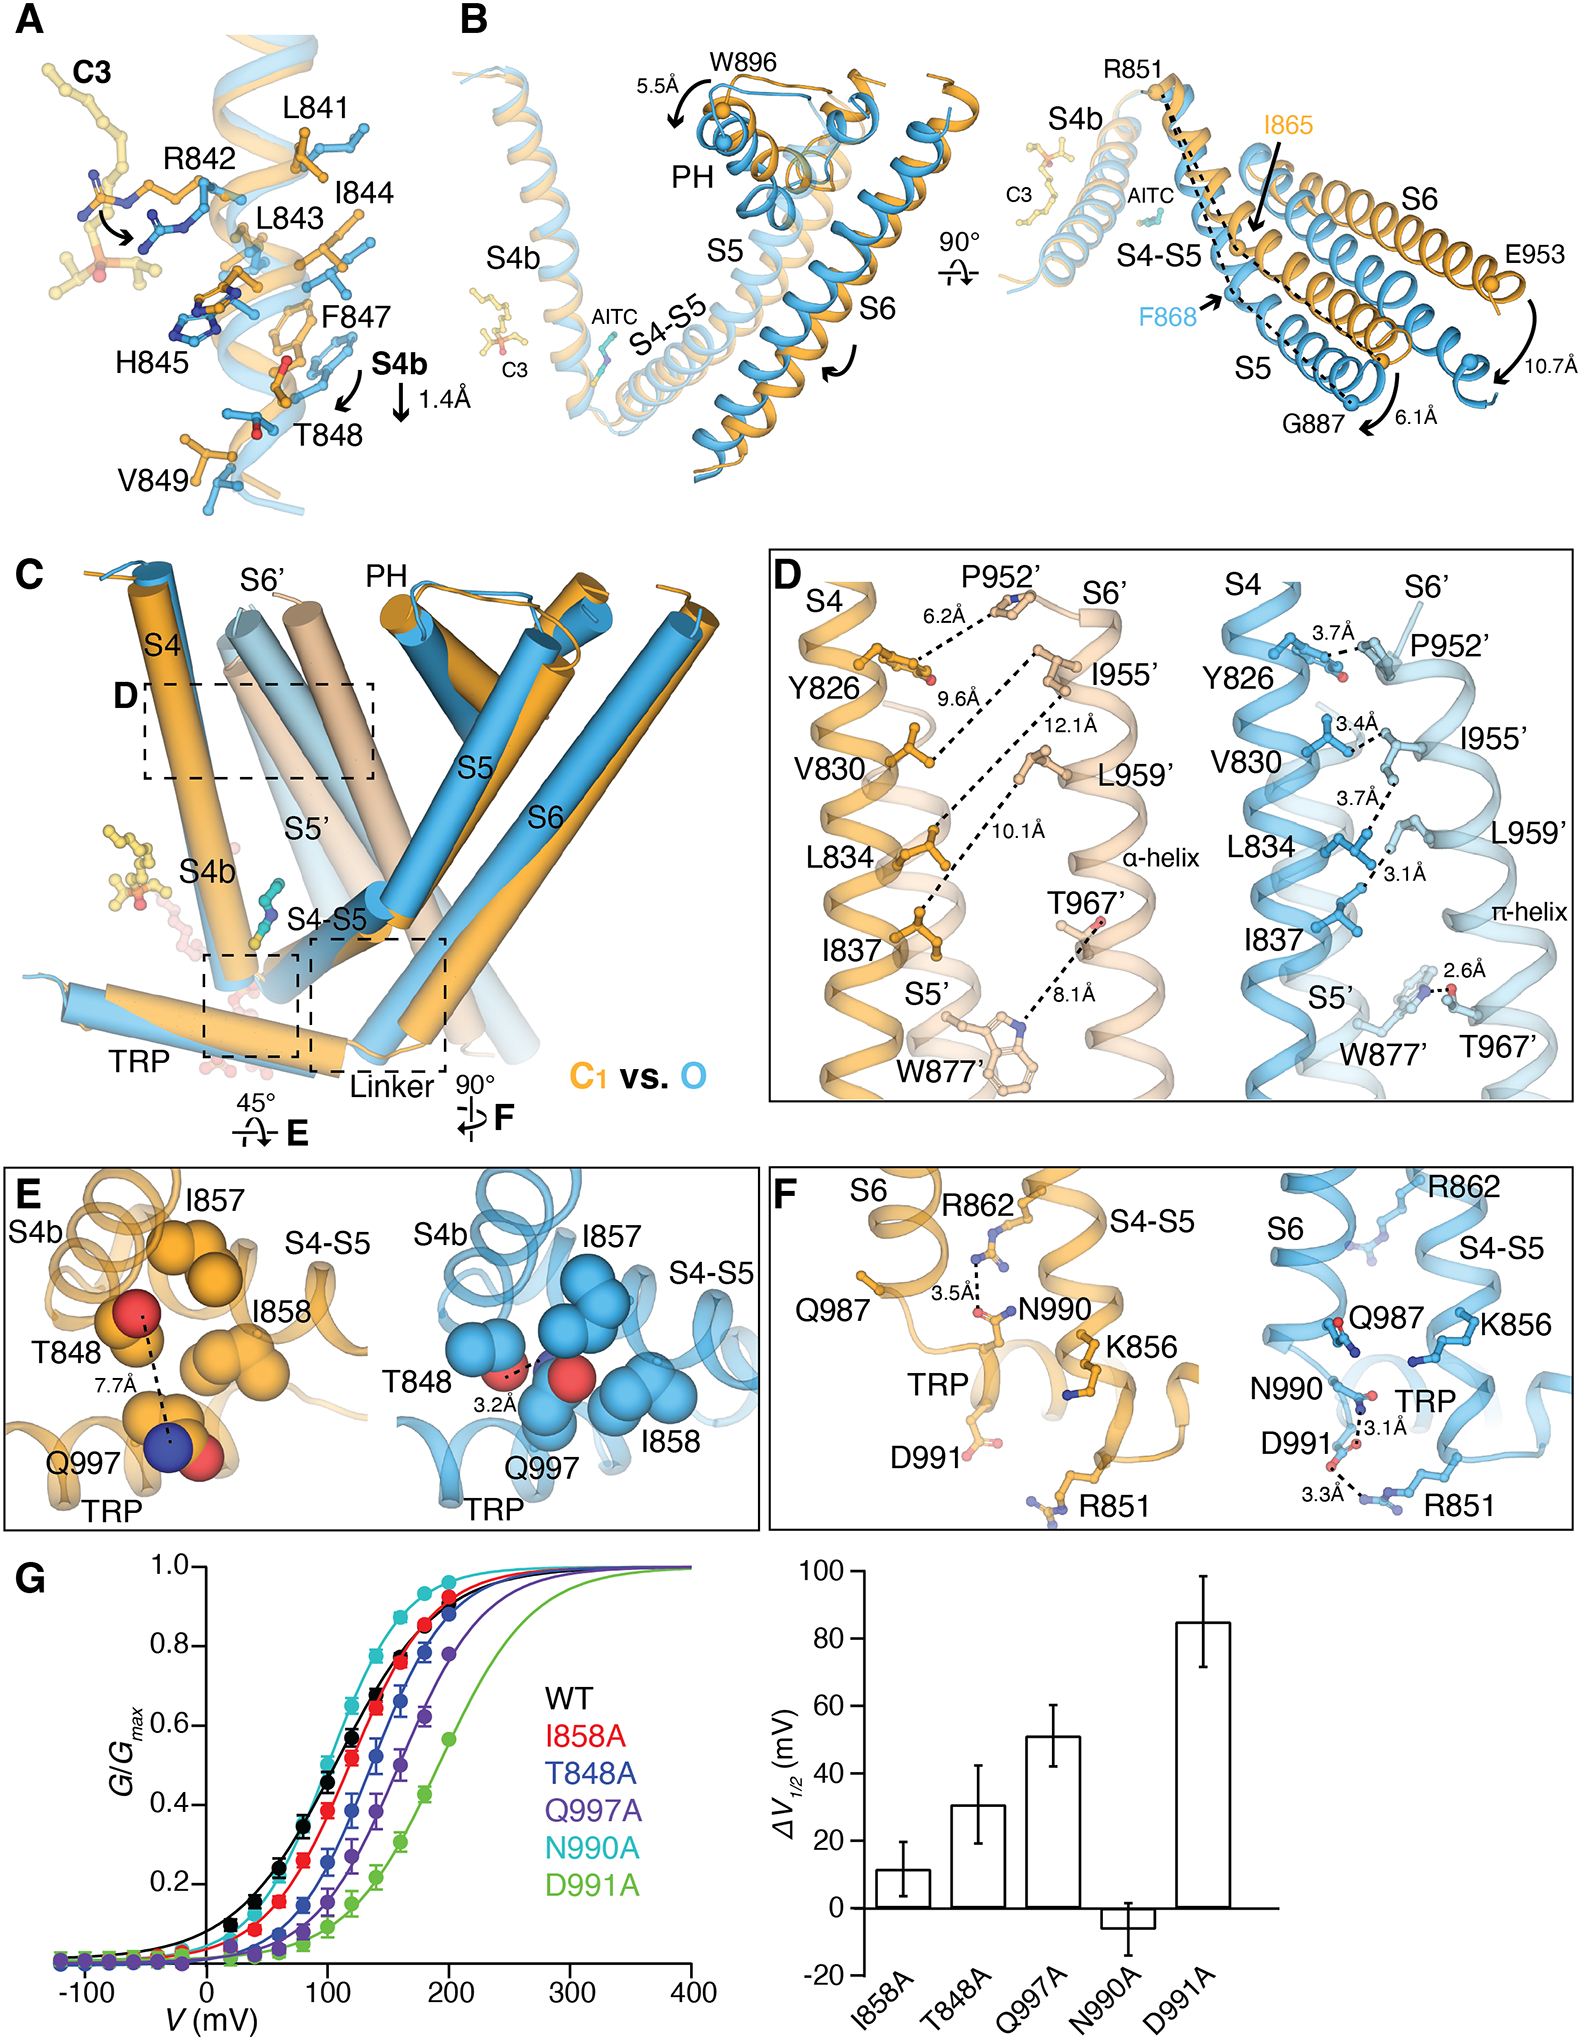
Figure 6. Structural basis of ligand-dependent gating of TRPM8MM.

(A) Structural overlay of the C1 (orange) and O (blue) states at S4b. C3 (yellow) and residue sidechains are shown in sticks. Arrows indicate downward movement and sidechain rotations.
(B) Comparison of the C1 (orange) and O (blue) state structures at the TMD, aligned at the VSLD. Arrows indicate movement in S5, PH, and S6 by the marked distances. Key residues for comparison are shown as spheres. Dashed lines (right panel) compare the change in the bending points (Ile865 and Phe868 as spheres) on S5. C3 and AITC are shown as sticks for orientation reference. S1 to S3 are removed for clarity.
(C) Comparison of two neighboring protomers in the C1 (orange and light orange) and O state (blue and light blue) at the TMDs. The channel is shown as cylinders and ligands as sticks. S1 to S3 are removed in chain A and only S5 and S6 are shown in chain B for clarity. Dashed regions are zoomed in for comparison in (D to F). Alignment was done using the entire tetrameric channel.
(D to F) Close-up views showing side-by-side comparison of the C1 (orange) and O state (blue) structures at inter- and intra-subunit interfaces marked in (C). Sidechains are shown in sticks [(D) and (F)] or spheres (E). Dashed lines indicate the minimum distances between the corresponding residues.
(G) (Left) G-V relationship of mutants at interfaces as indicated. (Right) Bar chart quantifying the difference of V1/2 between mutant and wildtype (ΔV1/2) as mean ± S.E.M. (n = 4 to 6 oocytes).
