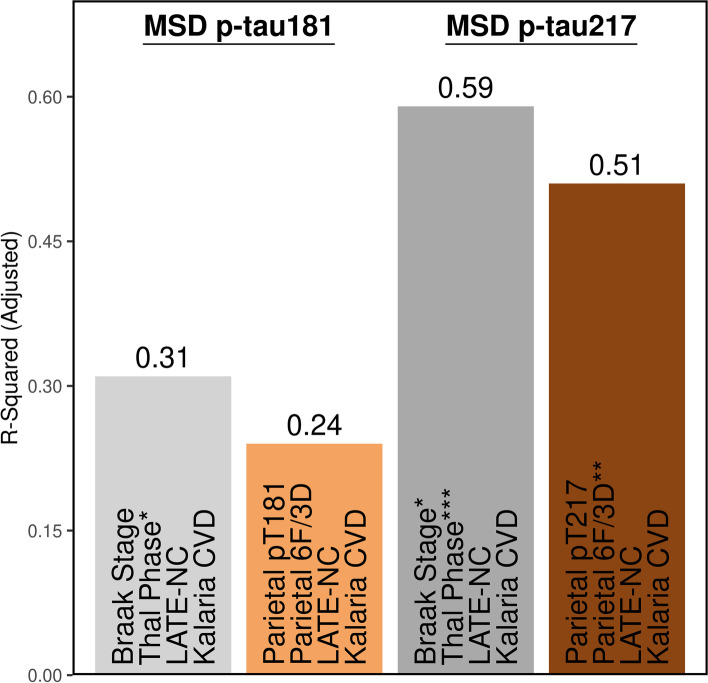
Fig. 3.
Multivariable linear regression modeling of neuropathologic variables as predictors of plasma p-tau levels. Global scales of tau and amyloid-β (Braak [25] and Thal [26], gray bars) and the strongest regional measure of tau and amyloid-β (parietal cortex, brown bars) were investigated as predictors of variability observed in plasma p-tau181 (left) and p-tau217 levels (right). To account for common co-pathologies, LATE-NC [16] and Kalaria cerebrovascular disease [15] were added to each model. Overall, the global scales performed better than the regional cortical measures with amyloid-β observed as strongest contributor to plasma p-tau variability. Time from plasma draw to death was not used to adjust, as it was not observed to associate with plasma p-tau levels. Case with high creatinine was not included. All variables in the model are shown, corresponding to Table S5. Significance denoted as *p < 0.05, **p < 0.01, ***p < 0.001. Acronyms: 6F/3D amyloid-β antibody, CVD cerebrovascular disease, LATE-NC limbic predominant age-related TDP-43 encephalopathy neuropathologic change, MSD meso scale discovery, p-tau phosphorylated tau for plasma levels, pT phosphorylated threonine for immunohistochemical measures of tau

