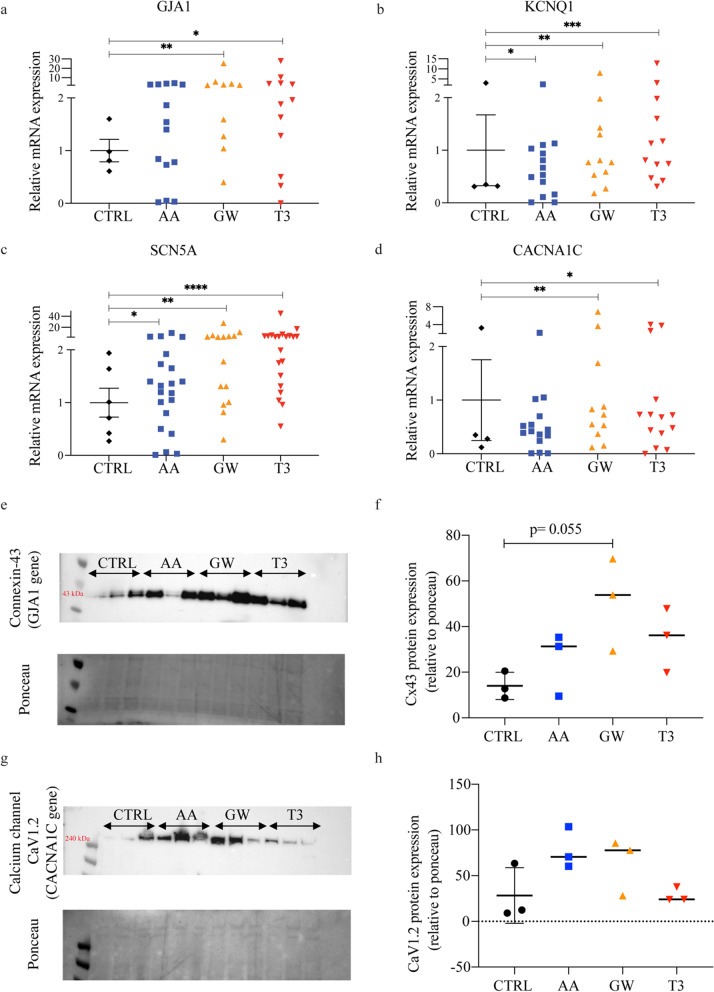
Fig. 6.
AA and GW treatment enhances ion channel expression. Relative gene expression of ion channel genes: a GJA1 CTRL versus AA, GW, and T3, respectively: 0.90 (0.66–1.45) versus 1.50 (0.56–2.78; n.s.), 2.21 (1.21–4.15; p = 0.0098), and 1.92 (0.70–3.83; p = 0.021); b KCNQ1 CTRL versus AA, GW, and T3, respectively: 0.34 (0.32–2.35) versus 0.6 (0.15–1.05; p = 0.048), 0.77 (0.53–1.43; p = 0.005), and 0.97 (0.54–0.89; p = 0.001); c SCN5A CTRL versus AA, GW, and T3, respectively: 0.86 (0.38–1.72) versus 1.32 (0.65–1.83; p = 0.034), 2.40 (1.01–4.49; p = 0.001), and 2.38 (1.41–4.07; p < 0.0001) d CACNA1C CTRL versus AA, GW, and T3, respectively: 0.32 (0.16–2.53) versus 0.42 (0.24–0.70; n.s.), 0.73 (0.37–1.69; p = 0.01), and 0.70 (0.31–1.41; p = 0.002). Western blots were performed on all three cell lines, and each lane contains pooled proteins from three experimental wells (total number of wells per condition = 9). Equal amount of protein was loaded in each lane; Ponceau staining is shown underneath the western blot panel as a loading control. e Cropped blots show protein levels of connexin-43 (43 kDa; GJA1 gene), and f protein levels of calcium channel CaV1.2 (240 kDa; CACNA1C gene). Full-length blots are available in Fig. S6

