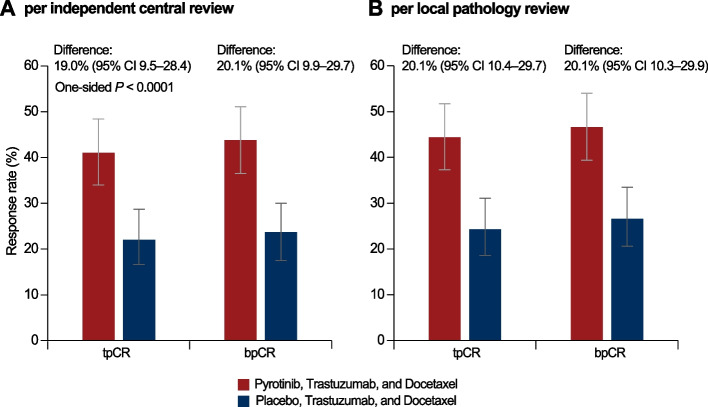
Fig. 2.
Total pathological complete response (tpCR) rate and breast pathological complete response (bpCR) rate. A Per independent central review; B per local pathology review. Patients with missing or unevaluable pCR status were considered non-responders. Error bars show 95% CIs for the pCR rate in each group, which were calculated using the Wilson method. Comparison between groups was done using the Cochran-Mantel-Haenszel test stratified by the randomization strata, and the 95% CI for the between-group difference was calculated using the Wald method

