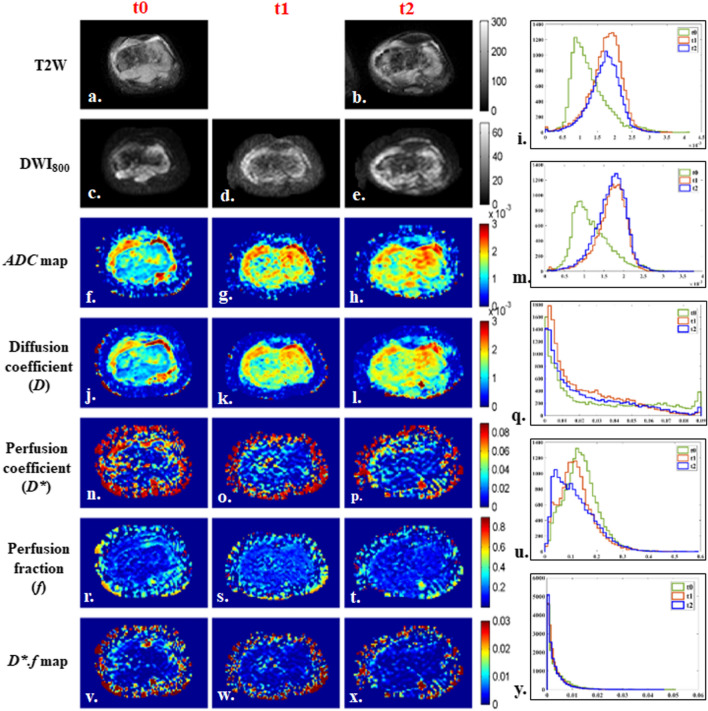
Fig. 2.
18 years old male patient from good-response group, with localized osteosarcoma of 284 cc volume in right distal femur at baseline. Patient had > 90% histological necrosis after surgery and event free survival and overall survival of 54 months. 1st, 2nd and 3rd columns show images at time points t0 (baseline), t1 (after 1st cycle of chemotherapy) and t2 (after completion of chemotherapy) respectively and 4th column represents histograms of parametric maps in tumor volume at three time-points t0 (green), t1 (orange) and t2 (blue). a, b T2-weighted fat saturated image, c–e DWI (b = 800 s/mm2), f–h Apparent diffusion coefficient (ADC), i Histogram of ADC was high peaked and sharp at t0, moved towards the right of the coordinate and became wider at t1 and t2. j–l Diffusion coefficient (D), m Histogram of D was high peaked and sharp at t0, moved towards the right of the coordinate at t1 and t2. n–p Perfusion coefficient (D*), q Histogram of D* was highly peaked and positively skewed with a heavy tail at t0, became more positively skewed with a lighter tail at t1 and t2. r–t Perfusion fraction (f), u Histogram of f was highly peaked at t0 and became more positively skewed and wider at t1 and t2. v–x D*.f, y Histogram of D*.f was high peaked at t0 and became more positively skewed and high peaked at t1 and t2

