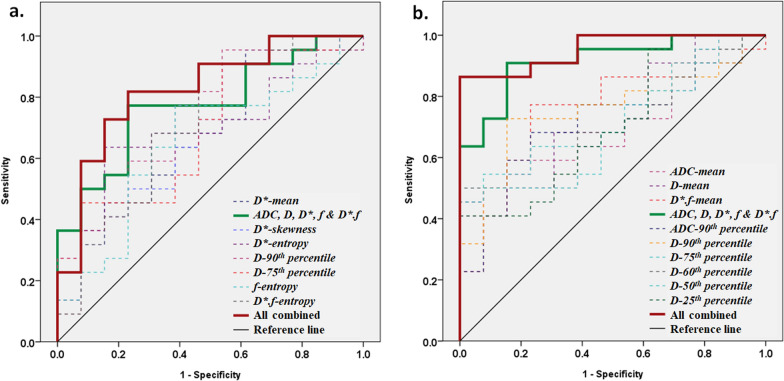
Fig. 5.
ROC curve analysis using mean and statistically significant (p < 0.05) histogram parameters of ADC, D, D*, f and D*.f a before commencement of chemotherapy (time-point t0) and b after 1st cycle of neoadjuvant chemotherapy (time-point t1). Mean parameters jointly showed AUC = 0.77, sensitivity = 77%, specificity = 77% at t0 and AUC = 0.92, sensitivity = 91%, specificity = 85% at t1; however, in combination with histogram parameters produced AUC = 0.87, sensitivity = 86%, specificity = 77% at t0 and AUC = 0.96, sensitivity = 86%, specificity = 100% at t1 in predicting poor-response to chemotherapy

