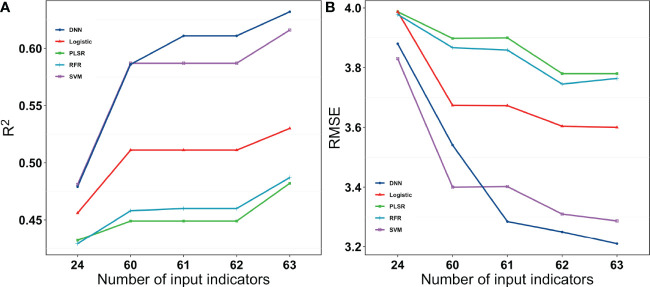
Figure 10.
R2 and RMSE for the different models with different input indices for grain weight per plant. 24 were vegetation indices. 60 were vegetation indices and texture indices. 61 were vegetation indices, texture indices, and canopy cover. 62 were vegetation indices, texture indices, canopy cover, and crop height. 63 were vegetation indices, texture indices, canopy cove, crop height, and lodging.

