
Fig. 2.
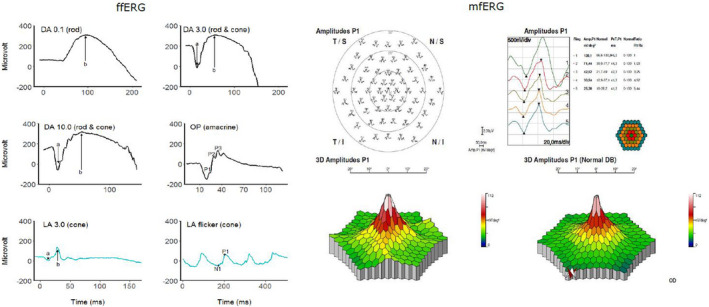
Example of a full‐field electroretinogram (ffERG) on the left and a multifocal electroretinogram (mfERG) on the right panel in a healthy subject. The dark‐adapted (DA) ffERG outcomes included DA0.01, DA3.0, DA10.0 and oscillatory potentials (OP), whereas the light adapted (LA) ffERG comprised the LA3.0 and LA flicker. The mfERG is presented both as a trace array and 3D map. For more details, please read the main text.