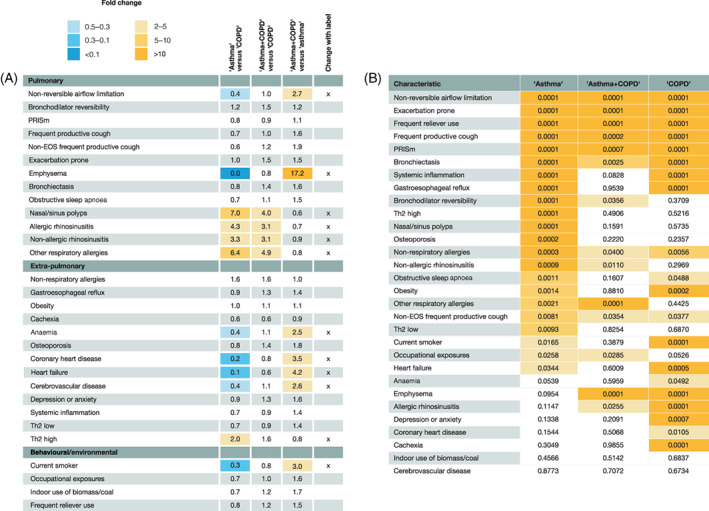
FIGURE 2.

(A) Heat map of fold changes in prevalence of TTs across the three diagnostic labels considered (columns from left to right: ‘asthma’ vs. ‘COPD’, ‘asthma + COPD’ vs. ‘COPD’ and ‘asthma + COPD’ vs. ‘asthma’). The final column highlights (x) those TTs with a ≥2‐ (orange cells) or ≤0.5‐ (blue cells) fold change between diagnostic labels. (B) Heat map of statistically significant p‐values (ANOVA) associated with differences in prevalence of a given TT by disease severity in patients with ‘asthma’, ‘asthma + COPD’ and ‘COPD’. TTs are ordered by p‐value in patients with ‘asthma’. Darkest shading, p ≤ 0.001; mid‐shading, p ≤ 0.01; light shading, p ≤ 0.05; no shading, p > 0.05. ANOVA, analysis of variance; COPD, chronic obstructive pulmonary disease; EOS, eosinophilic; PRISm, preserved ratio impaired spirometry; Th2, type‐2 airway inflammation; TT, treatable trait
