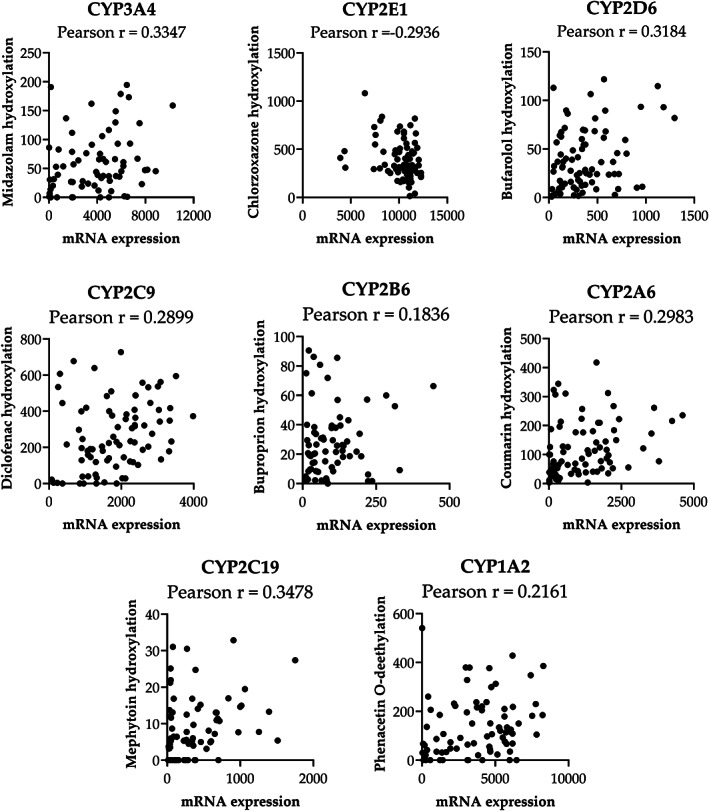
Figure 1.

Correlation between CYP mRNA expression and enzyme activity in human liver tissue and microsomes. The mRNA values are presented as the raw signals from GenomeStudio. Activity values are presented as pmol/min/mg microsomal protein measured after 10 minutes of drug incubation. Outliers were detected using the Robust Regression followed by Outlier Identification (ROUT) method, Q value 0.1. Pearson correlation coefficient calculated using GraphPad Prism 9.
