Figure 3.

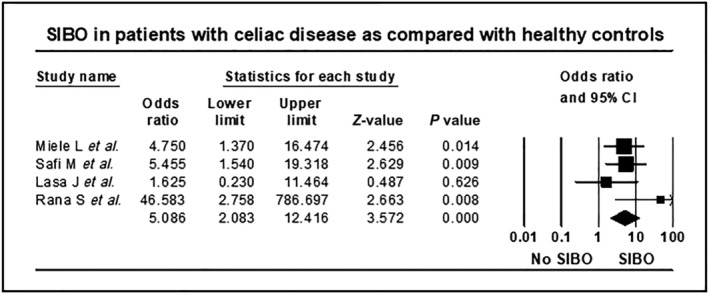
Forest plot of studies showing prevalence of SIBO in patients with celiac disease and heathy controls, stratified according to mode of diagnosis of SIBO (OR = 5.1, 95% CI 2.1–12.4, P = 0.0001, I 2 = 18.7, P = 0.297).

Forest plot of studies showing prevalence of SIBO in patients with celiac disease and heathy controls, stratified according to mode of diagnosis of SIBO (OR = 5.1, 95% CI 2.1–12.4, P = 0.0001, I 2 = 18.7, P = 0.297).