
Fig. 3.
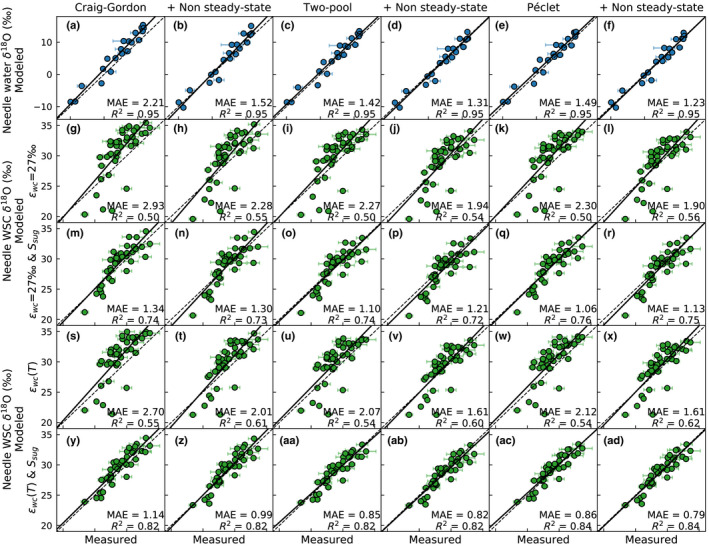
The fit between modeled and measured Scots pine (a–f) needle water δ18O, and (g–ad) δ18O of needle water‐soluble carbohydrates (WSC) with different needle water modeling approaches (see column titles) and model processes affecting δ18O of needle WSC. In (g–r) the biochemical fractionation factor, ε wc, is constant (27‰) and in (s–ad) ε wc is temperature dependent following Sternberg & Ellsworth (2011). In (m–r) and (y–ad) the needle sugar pool size is set according to measurements, while in (g–l) and (s–x) its size is negligible. The dashed line is 1 : 1 and the solid line the linear least squares regression. R 2 and MAE denote the coefficient of determination and mean absolute error, respectively. Modeled values are given as mean of 12:00–15:00 h, which corresponds to sampling interval. Error bars indicate the SDs of the five sampled trees.