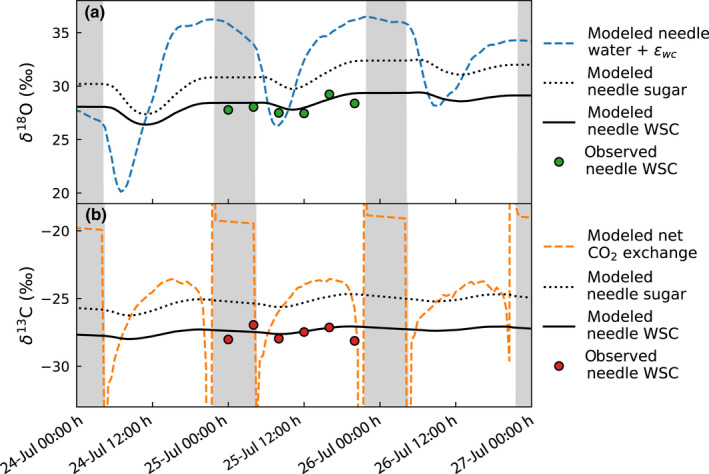
Fig. 6.

Modeled diurnal course of (a) δ18O and (b) δ13C signals in Scots pine needles during 24–26 July 2019 and measured needle isotopic signals of water‐soluble carbohydrates (WSC) sampled during 25 July 2019. In addition to modeled needle sugar and bulk WSC signals, (a) shows the isotopic signal of needle water + ε wc (biochemical fractionation factor) and (b) the isotopic signal of net CO2 exchange. Gray‐shaded areas indicate night‐time. Extreme high and low values during the transition between day and night are caused by noise in model results when kC a – r d tends to zero (see Eqn 8).
