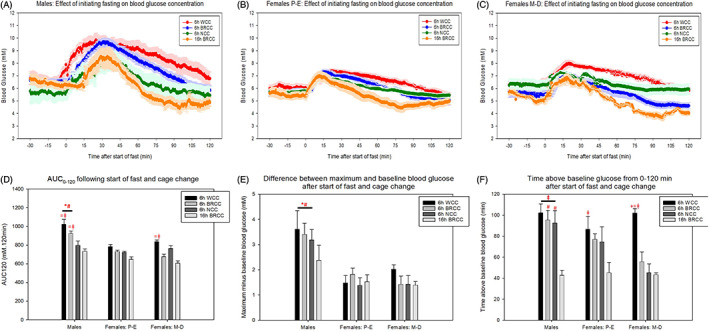
FIGURE 1.

The initial effects of 6‐hour and 16‐hour fasting on blood glucose concentrations from 30 minutes pre‐intervention to 120 minutes post‐intervention in (A) males, (B) females in proestrous‐oestrous (P‐E) and (C) females in metoestrous‐dioestrous (M‐D). (D) Area under the curve (AUC)120 for graphs (A‐C). (E) Difference between maximum blood glucose reached from 0 to 120 minutes following intervention and pre‐intervention baseline. (F) Time spent above pre‐intervention blood glucose concentrations from 0 to 120 minutes post‐intervention. Pre‐intervention glucose was quantified as the average glucose between −30 and −15 minutes. * and # represent a significant difference compared to females in P‐E and M‐D, respectively. ~, +, = and ⱡ represent a significant difference compared to 6 hours with whole cage change (WCC), 6 hours with bedding retention cage change (BRCC), 6 hours with no cage change (NCC) and 16 hours with BRCC, respectively (P < 0.05, two‐way ANOVA with Holm‐Sidak post hoc tests). Data are mean ± SEM (n = 7 for males, n = 5‐7 for females in P‐E and n = 4‐7 for females in M‐D)
