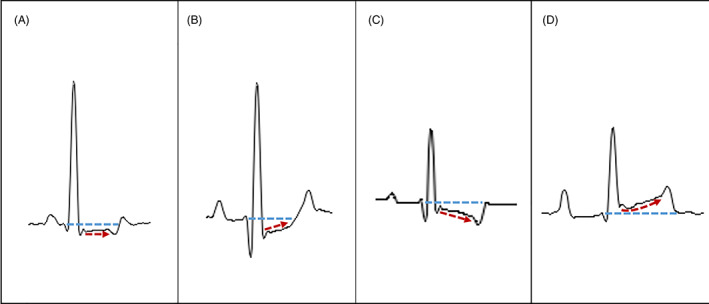
FIG 1.

Selected close‐ups from electrocardiographic tracings obtained from four healthy dogs. In all cases, a single complex recorded in lead II was selected to illustrate in detail the distinct ST segment morphological patterns. (A) Horizontal depression. (B) Upsloping depression. (C) Downsloping depression. (D) Concave elevation. Fine undulations of the black lines which represent the contour of the electrocardiographic waves, intervals and segments are inevitably due to overmagnification of the tracings. In each panel, the blue and red dotted lines help to identify the reference baseline and ST segment morphologies, respectively
